

Wings for Life World Run
/10
live project
Client
Red Bull, Wings for Life World Run
Industry
Global charity race, Foundation
Involvement
Wire-framing, UI/UX Design, Graphic Design, Design System
task
The client required a redesign of the existing website to make it more modern, interactive, and accessible to a broad audience, including both participants and followers.
approach
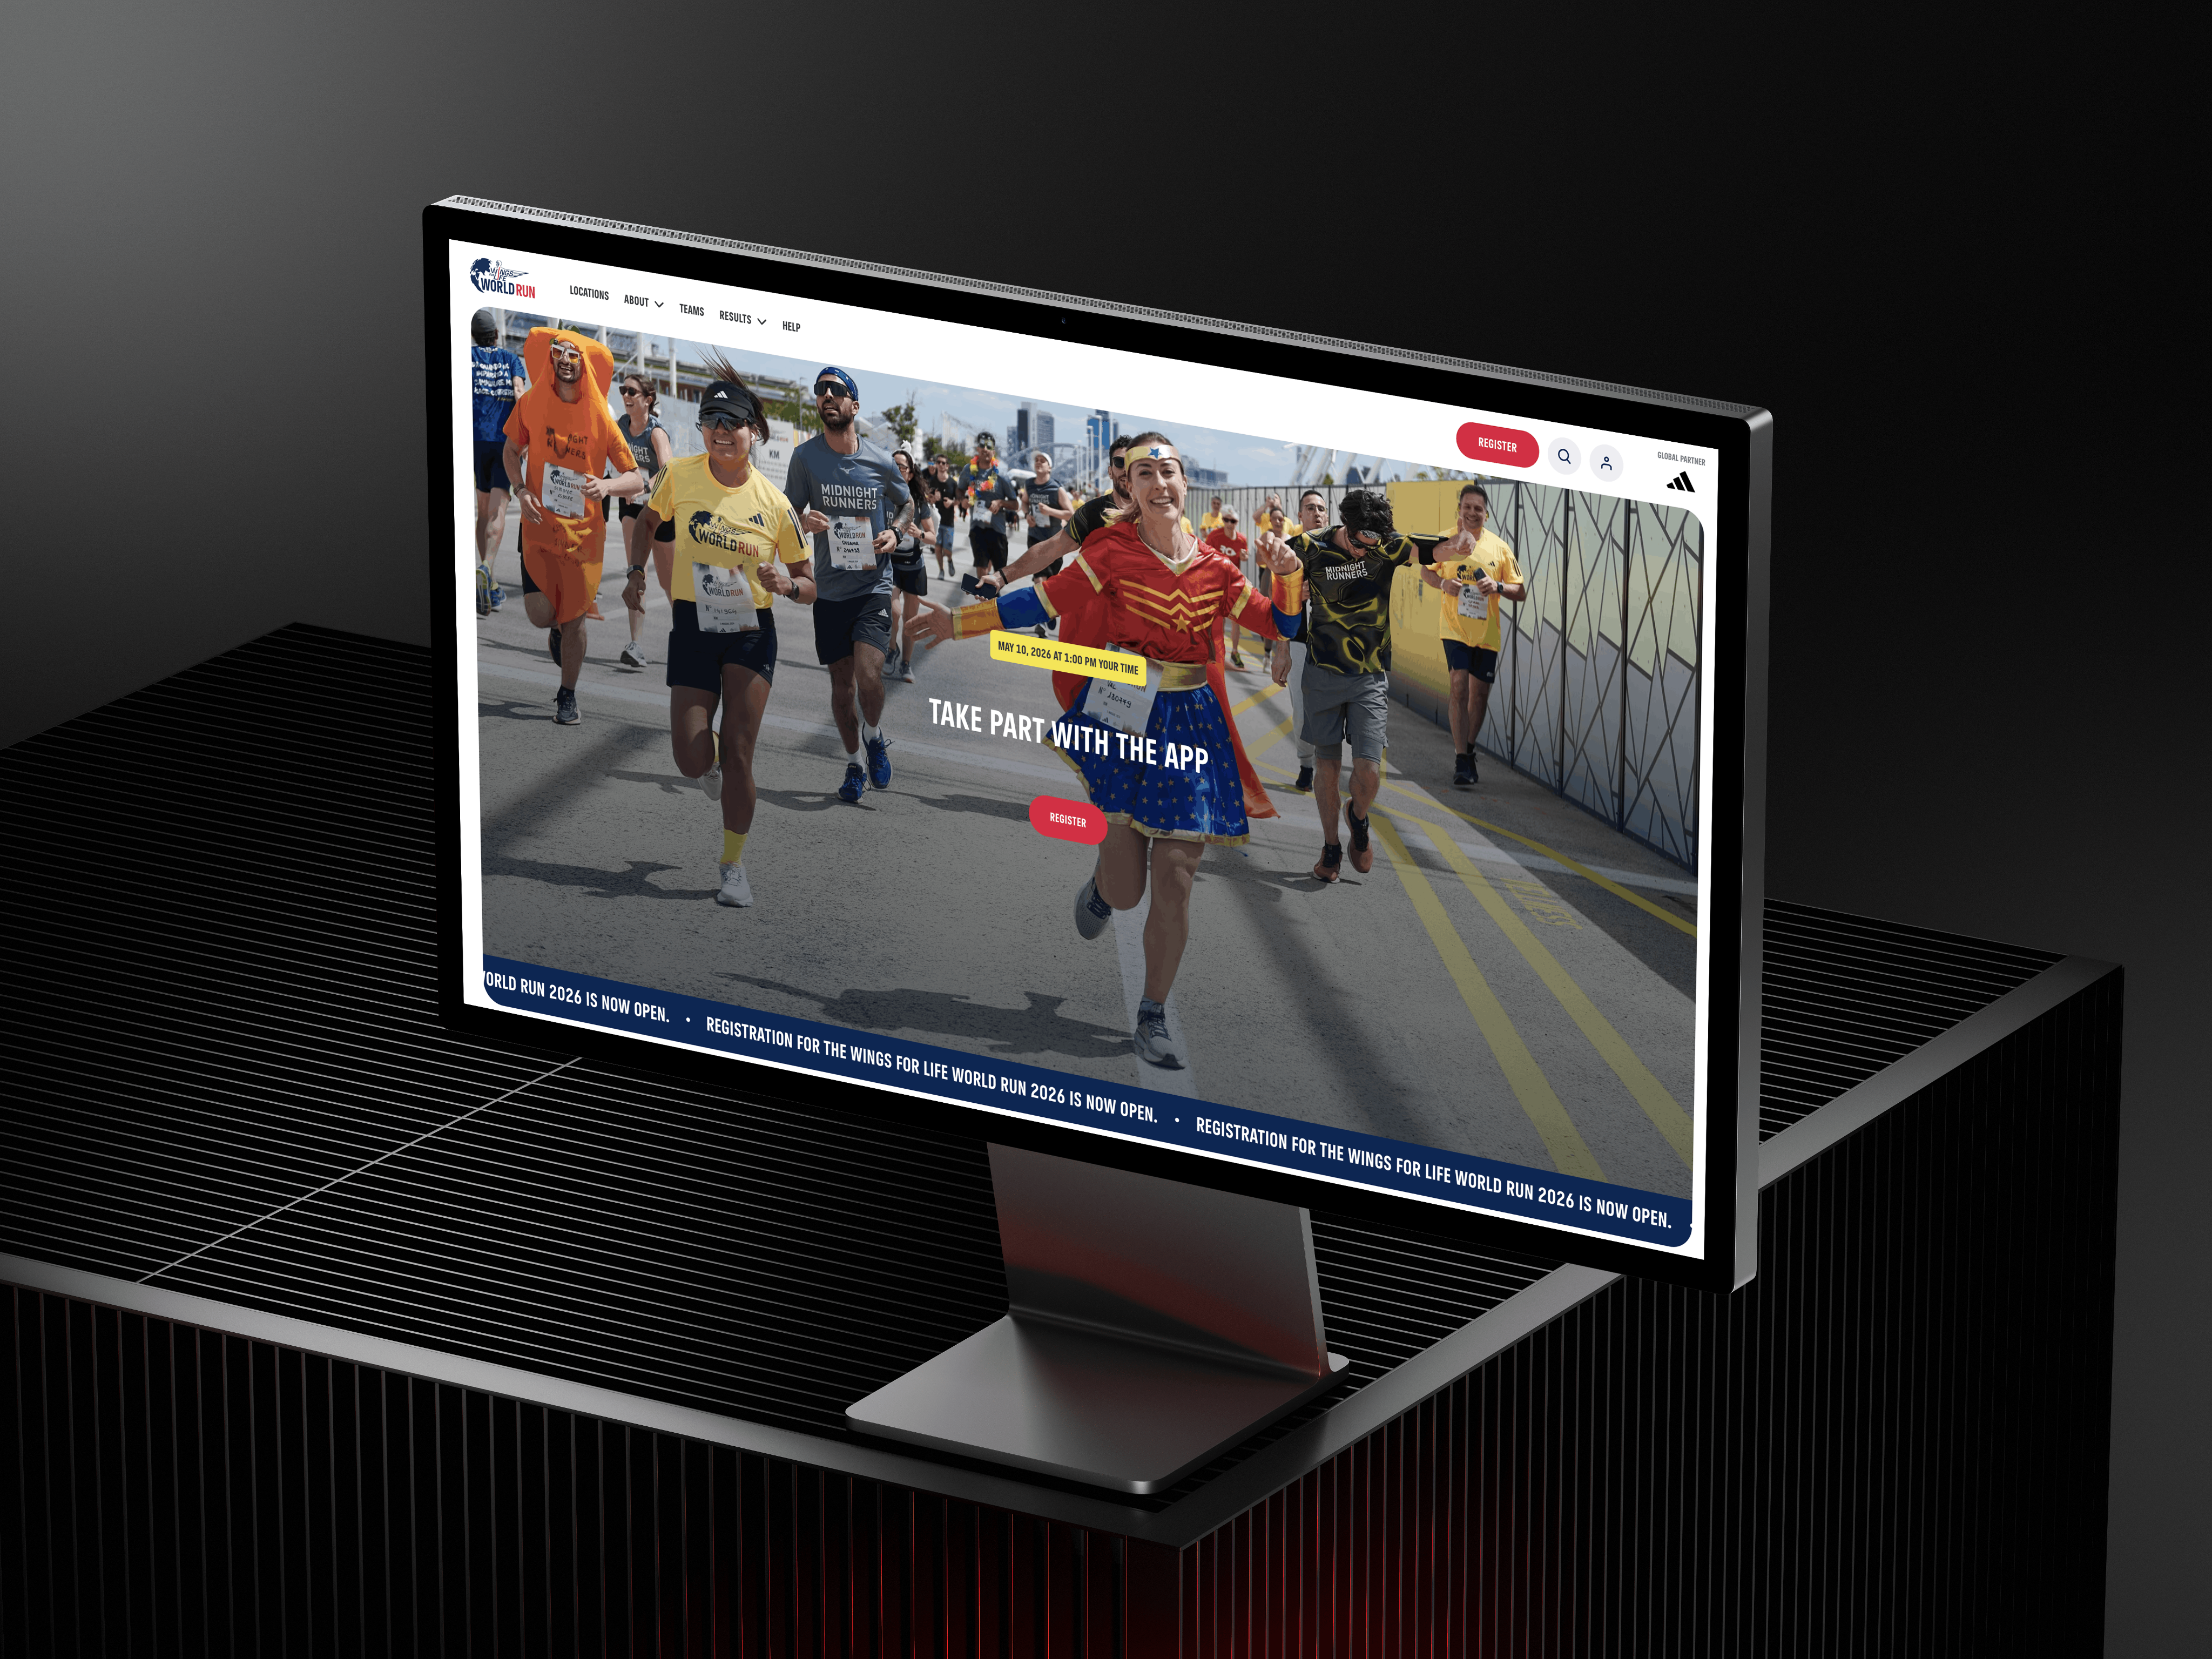
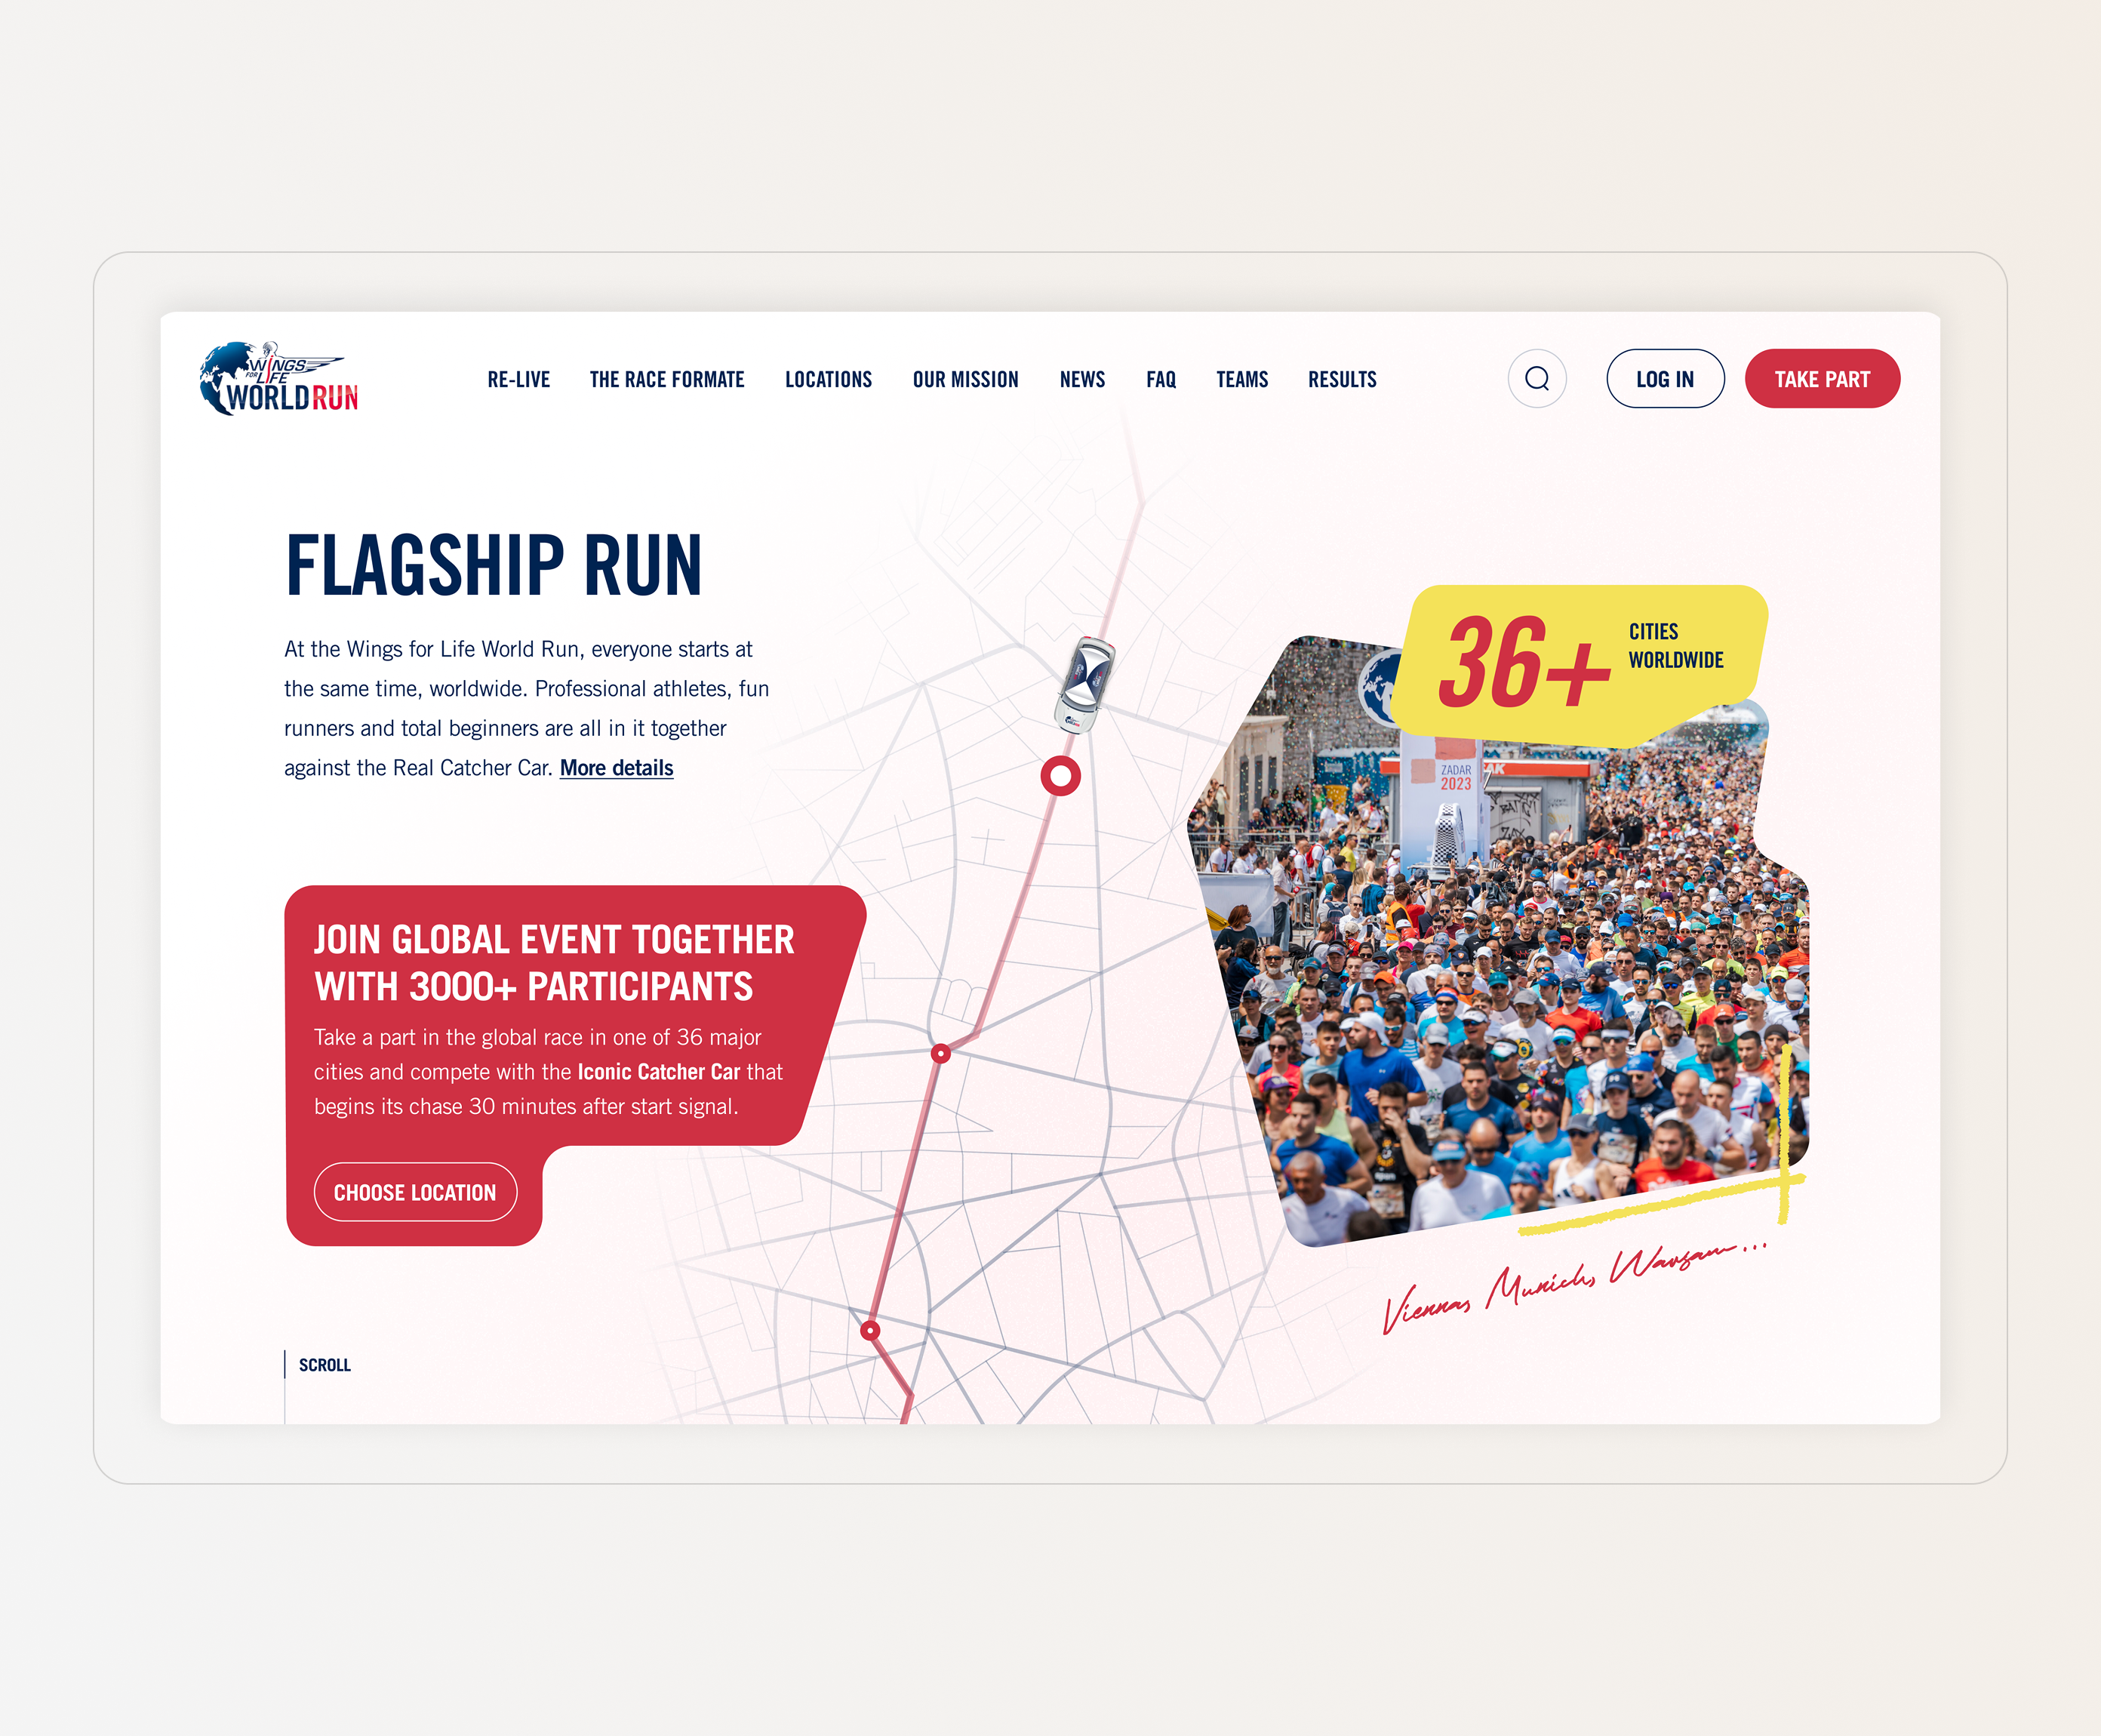
My proposal was to create a dynamic path illustrating the car’s movement from point to point, serving as the central design element. This path would unify the different sections into a cohesive journey, with visual content that evolves and updates as the user scrolls.
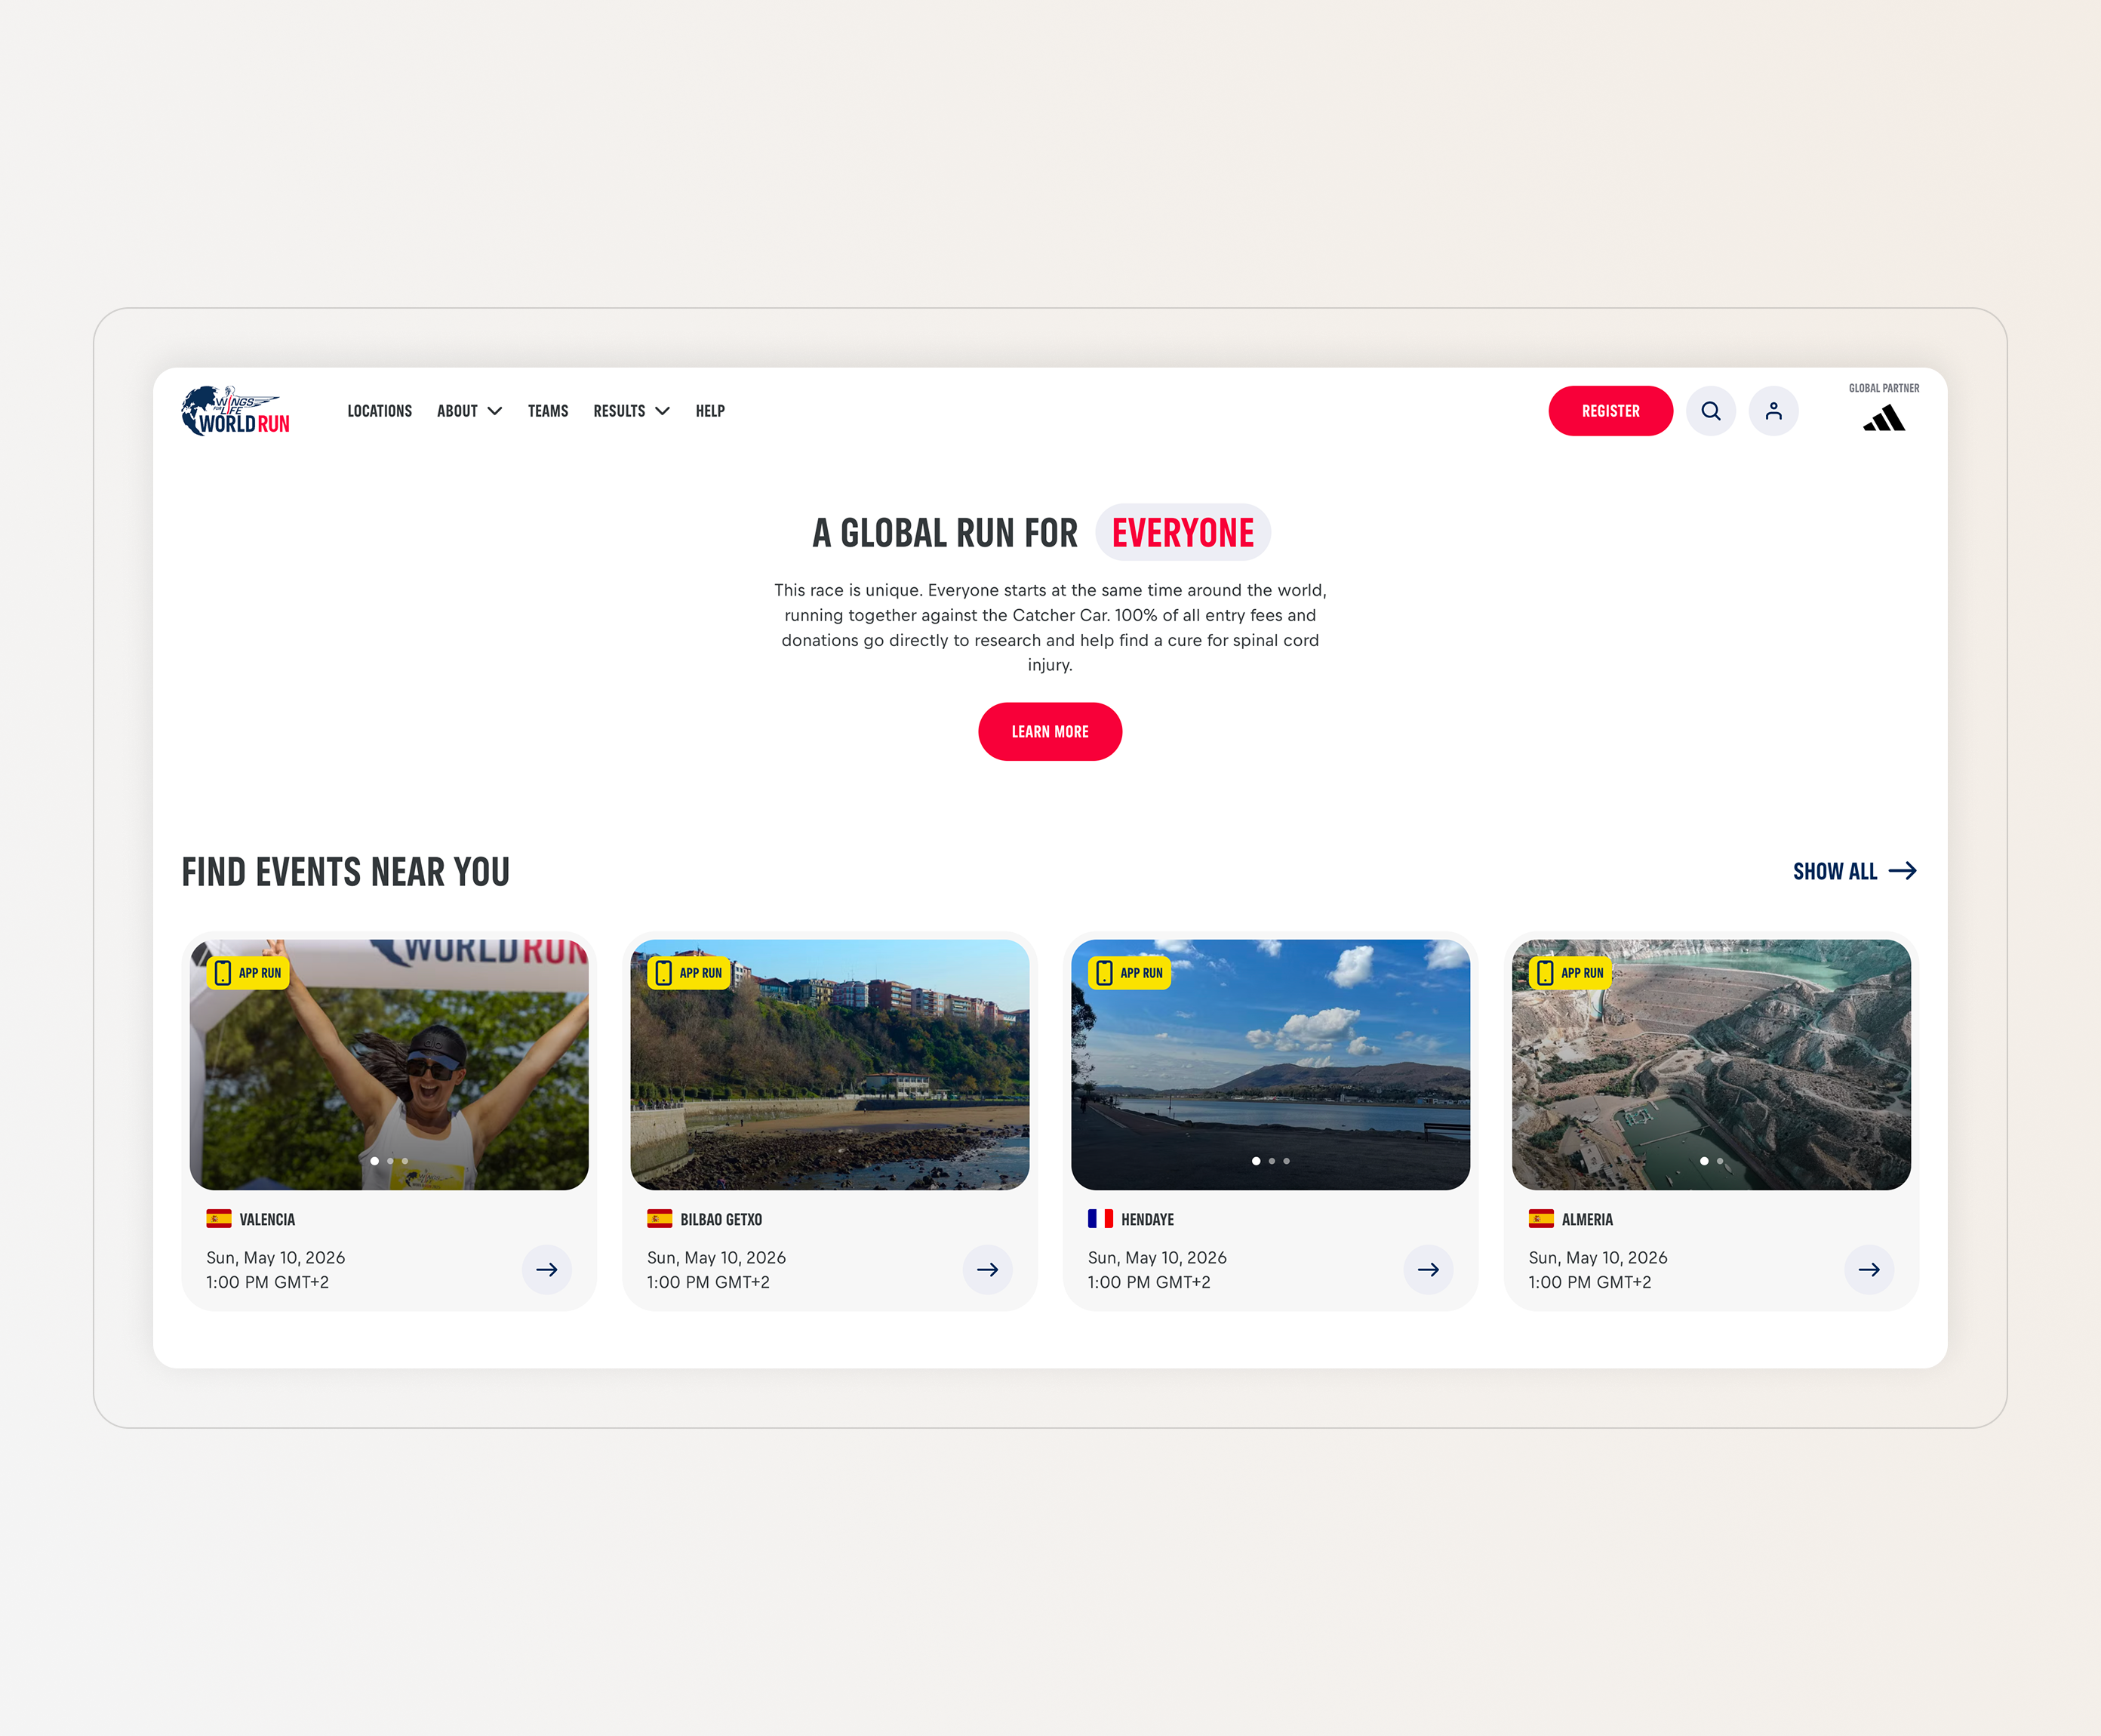
A global run for everyone.
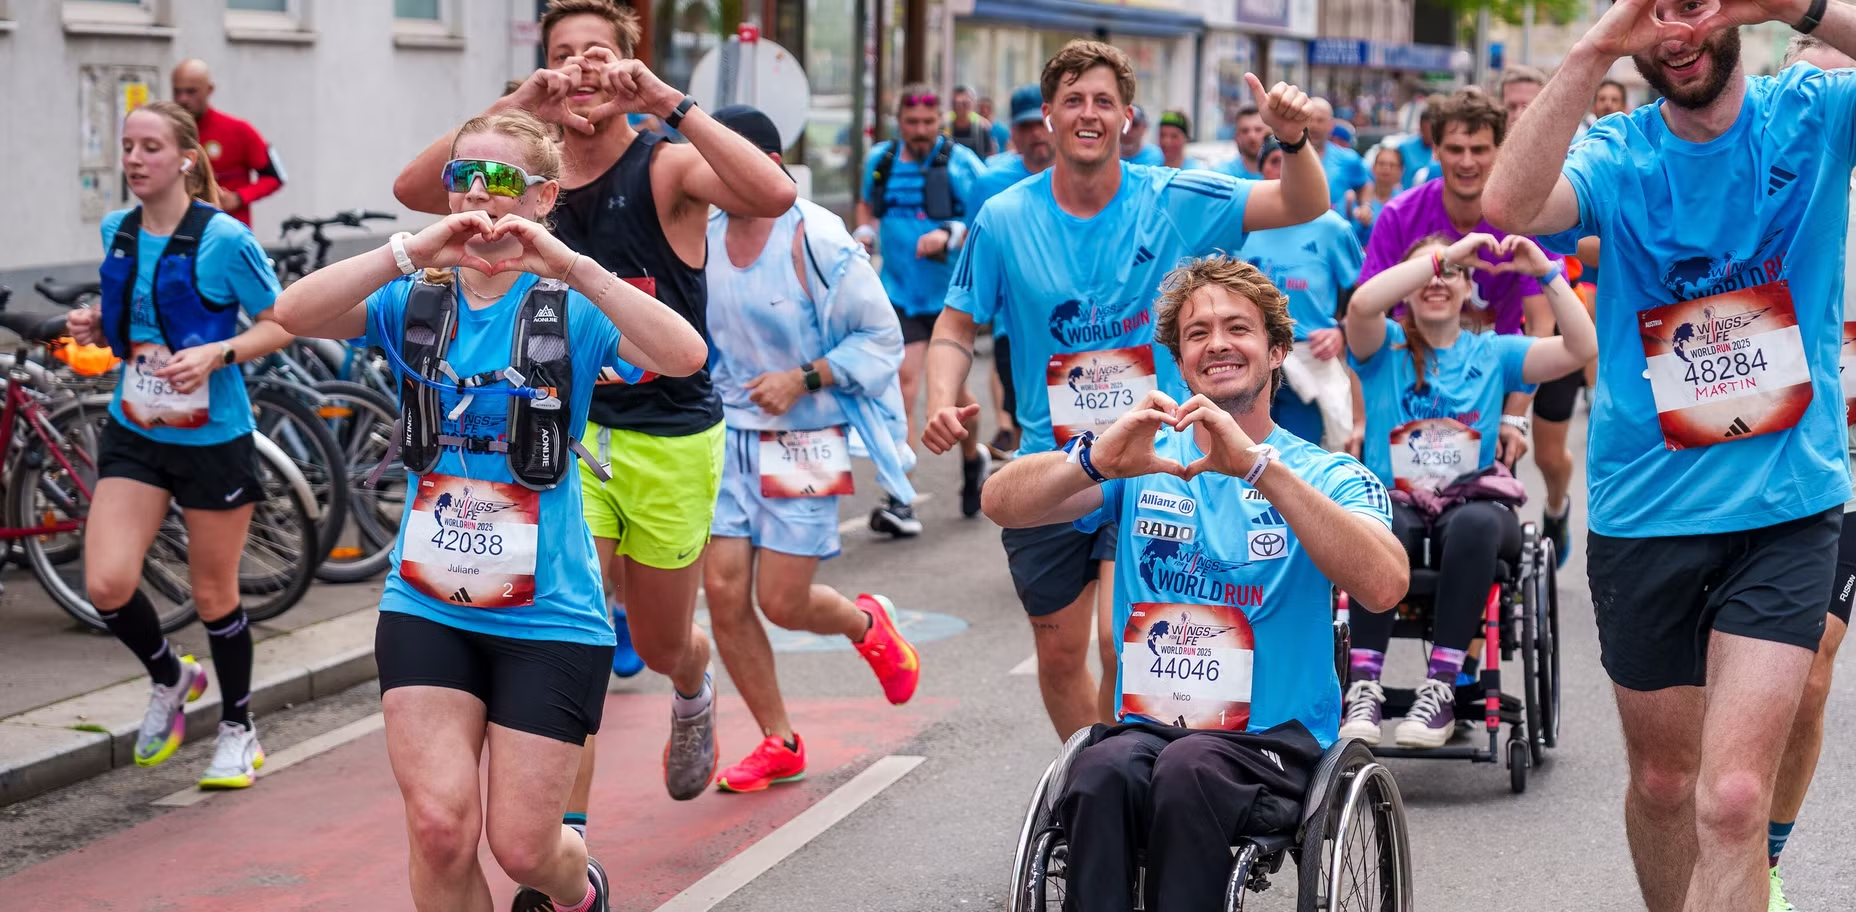
This race is unique. Everyone starts at the same time around the world, running together against the Catcher Car. 100% of all entry fees and donations go directly to research and help find a cure for spinal cord injury.
Design Concepts
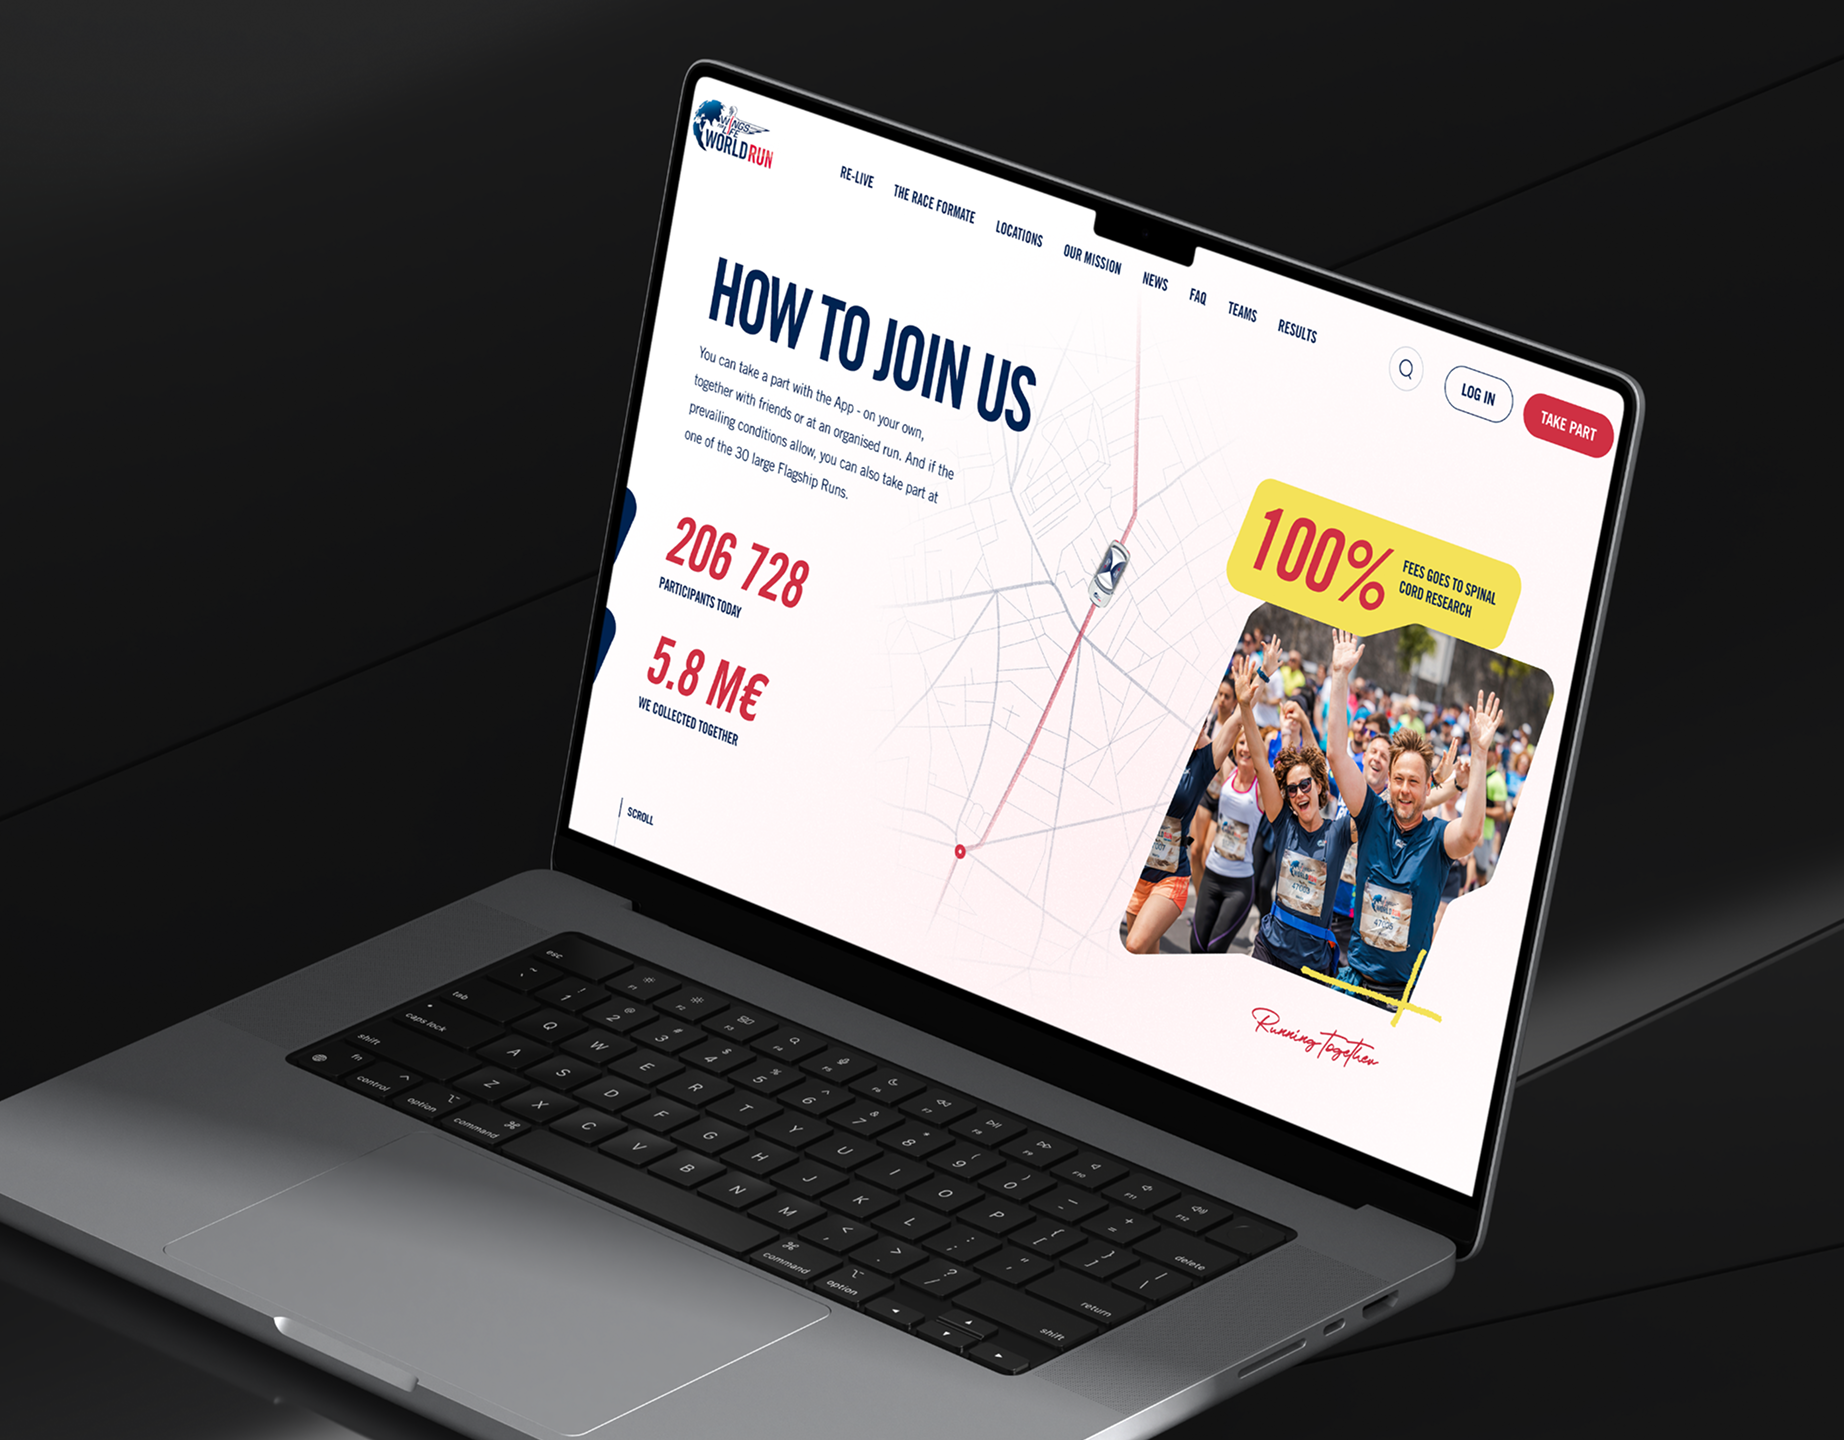
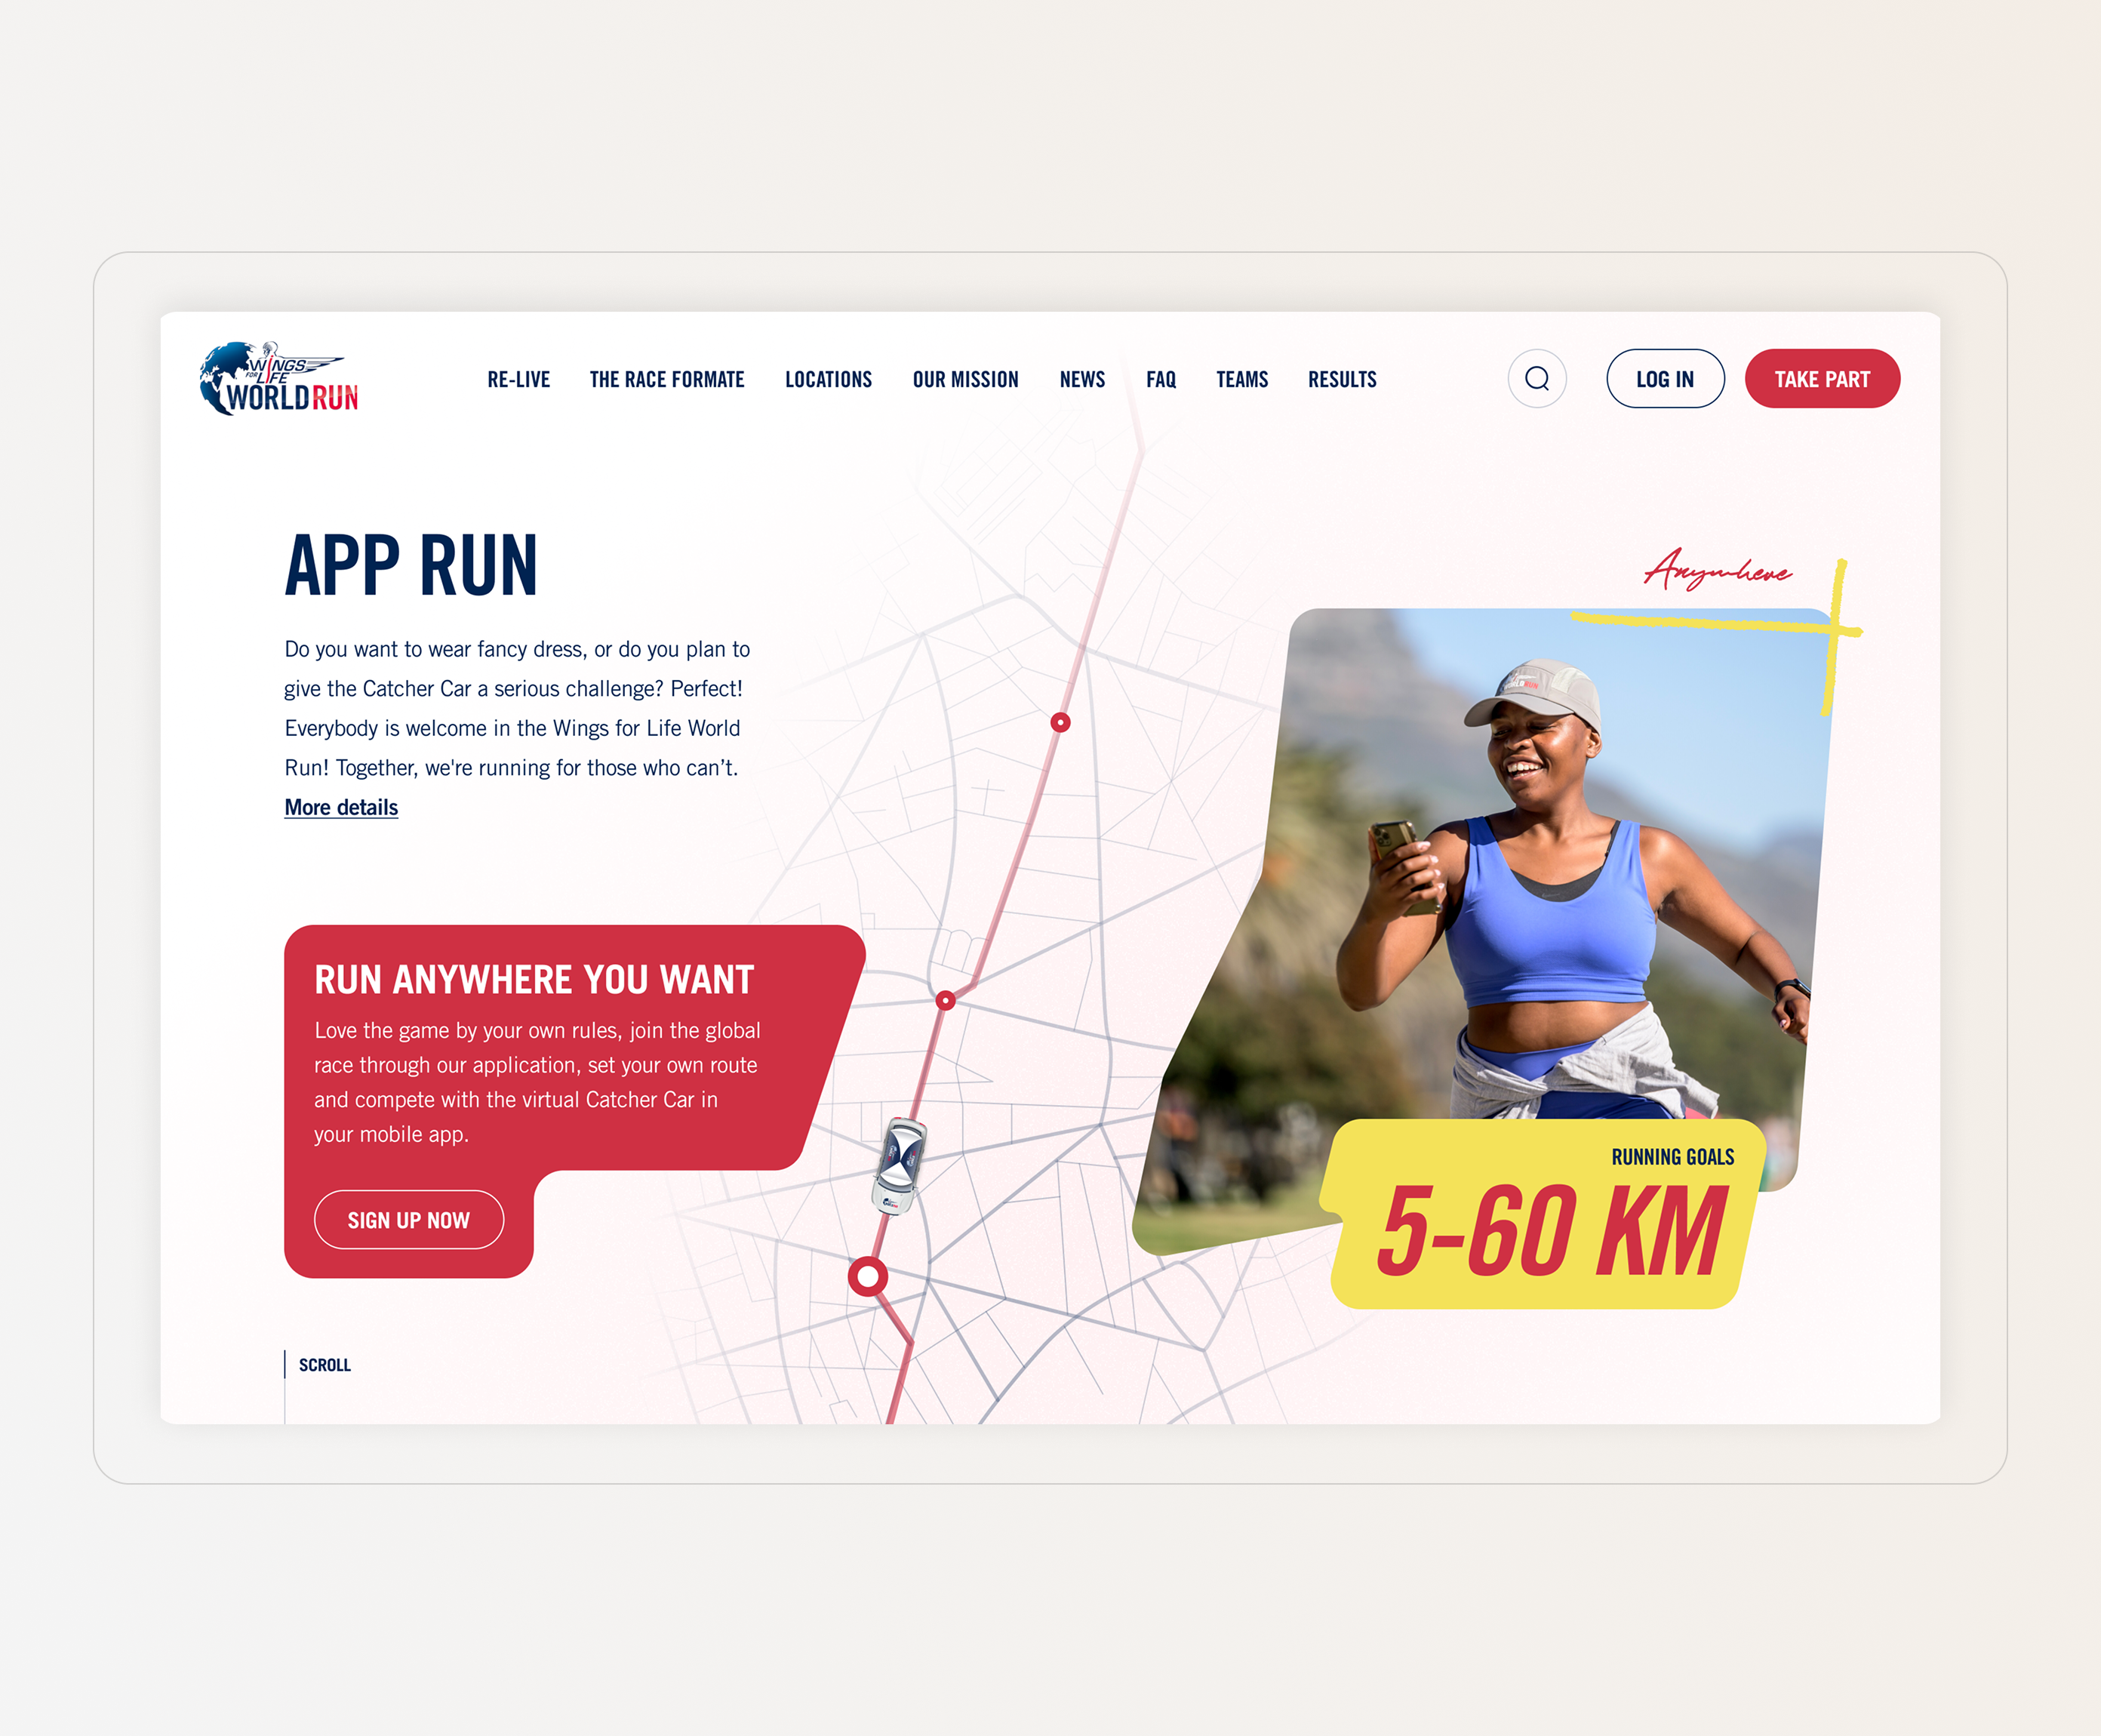
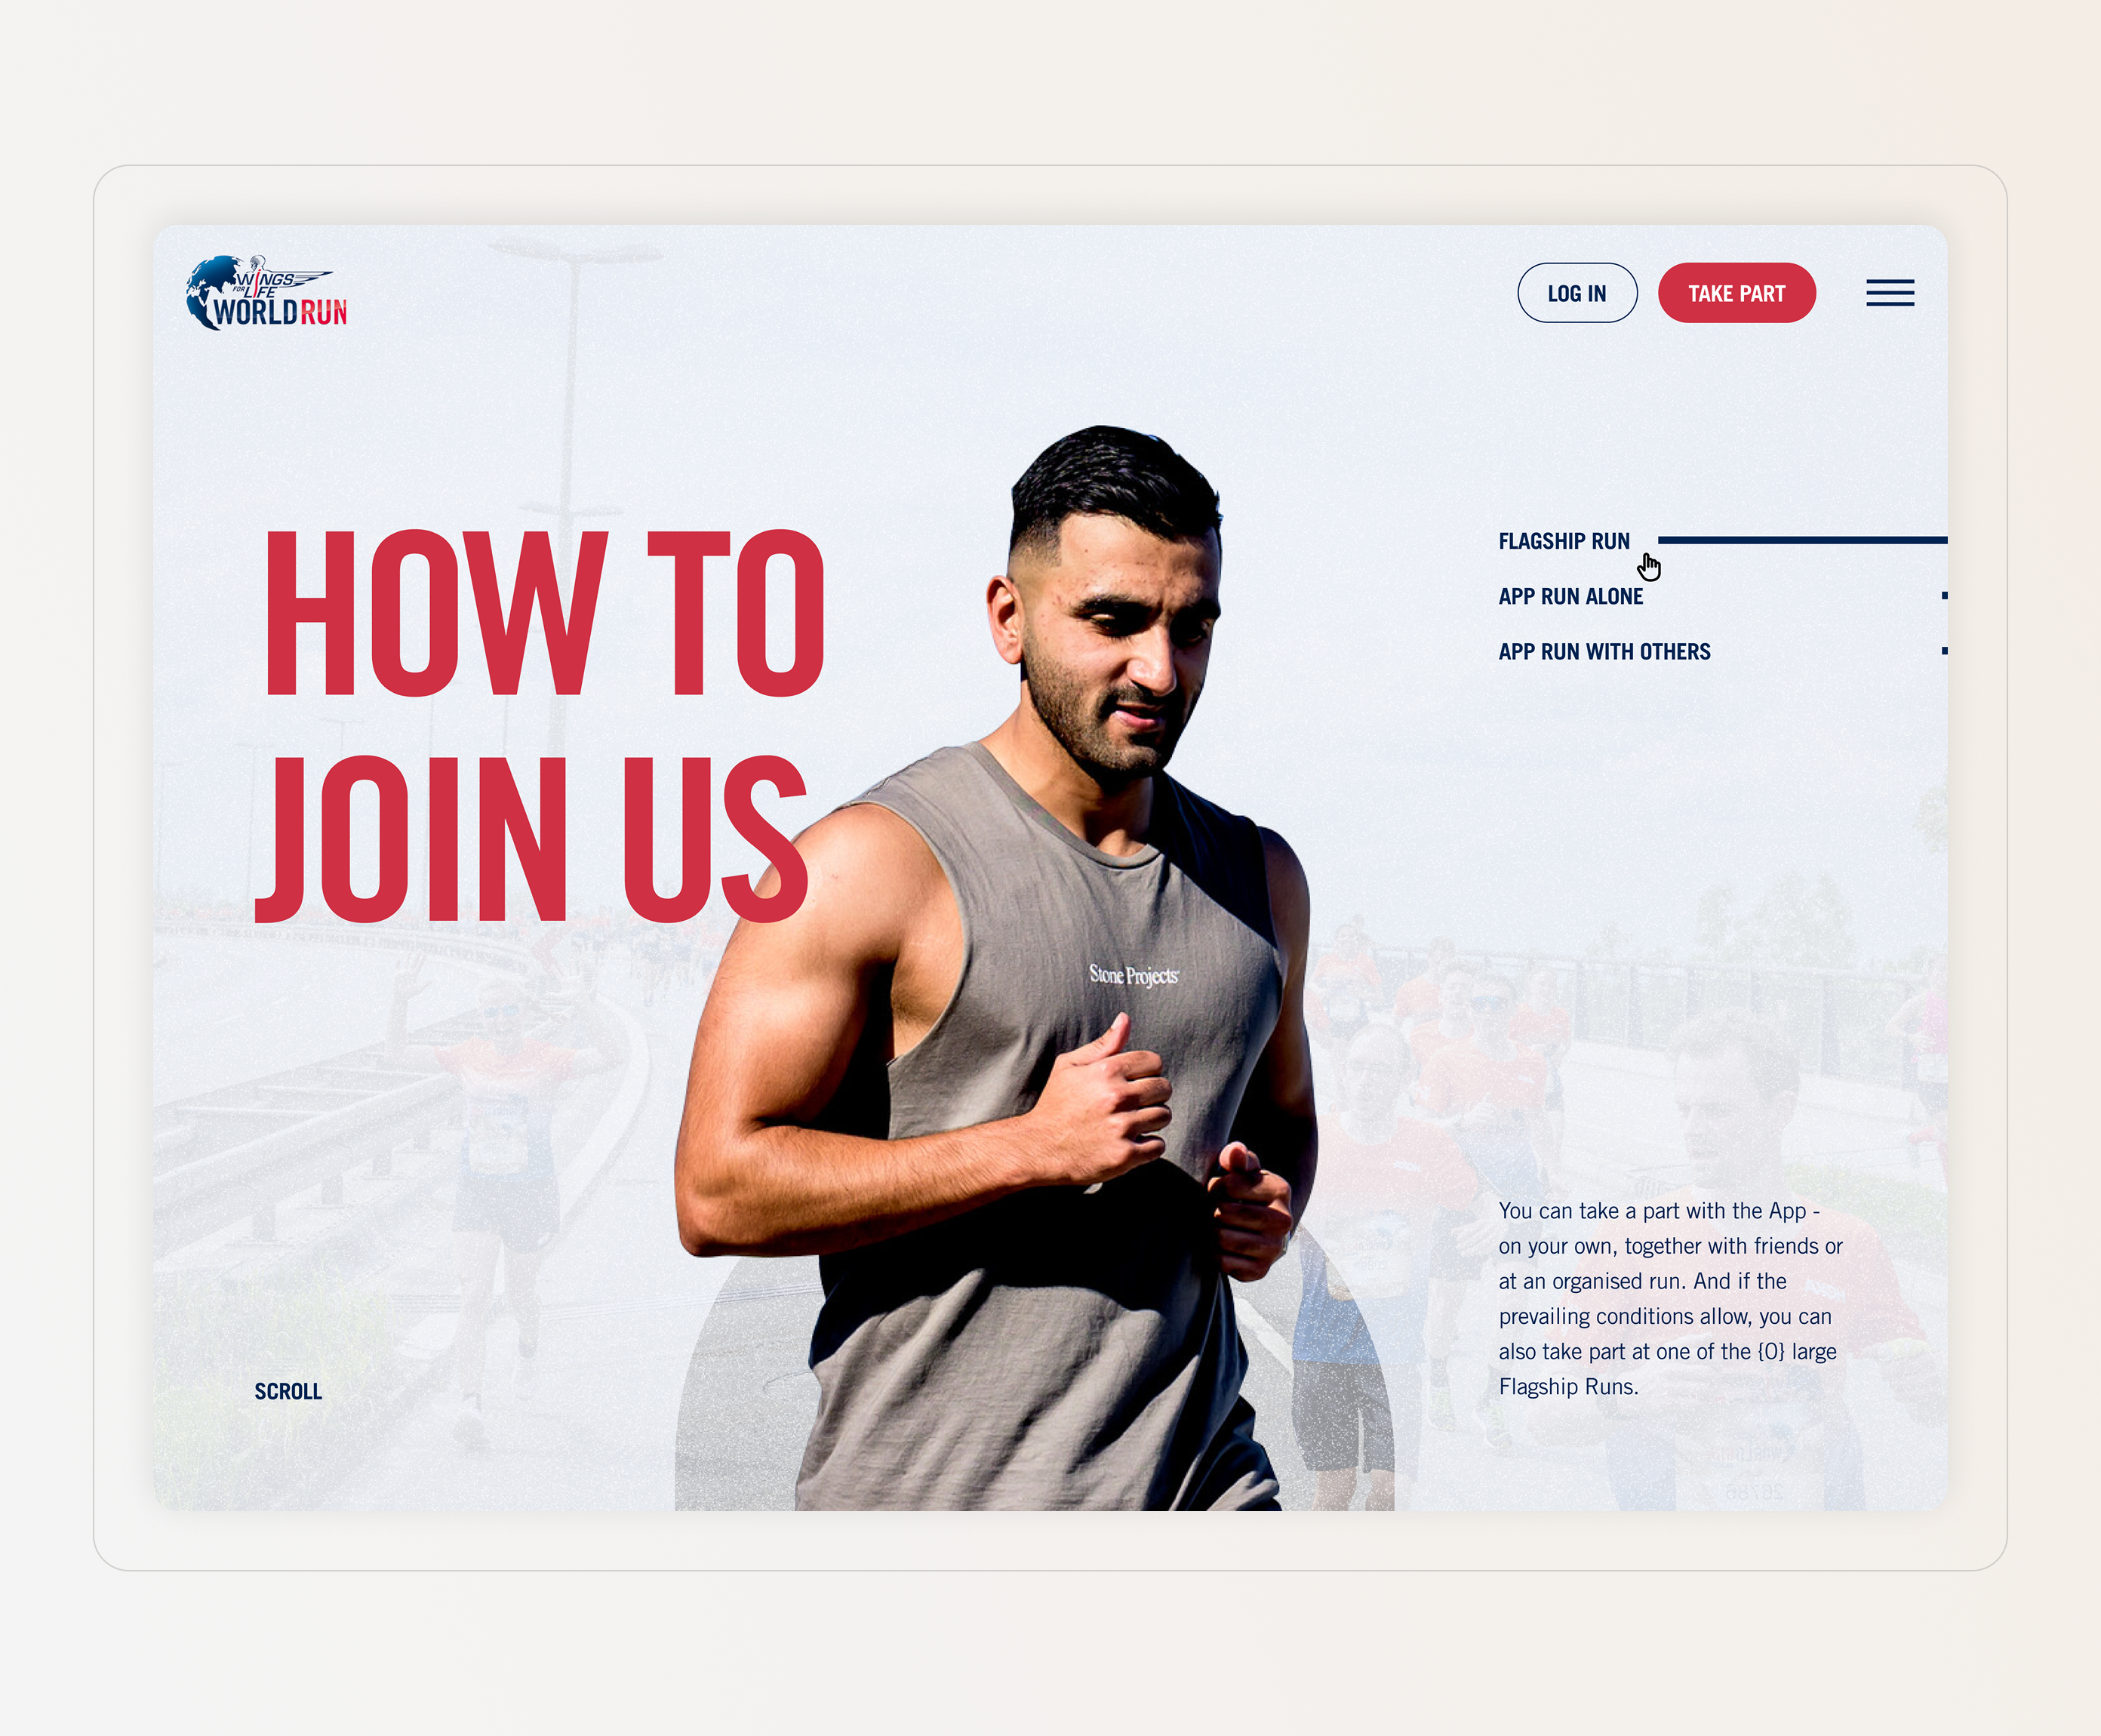
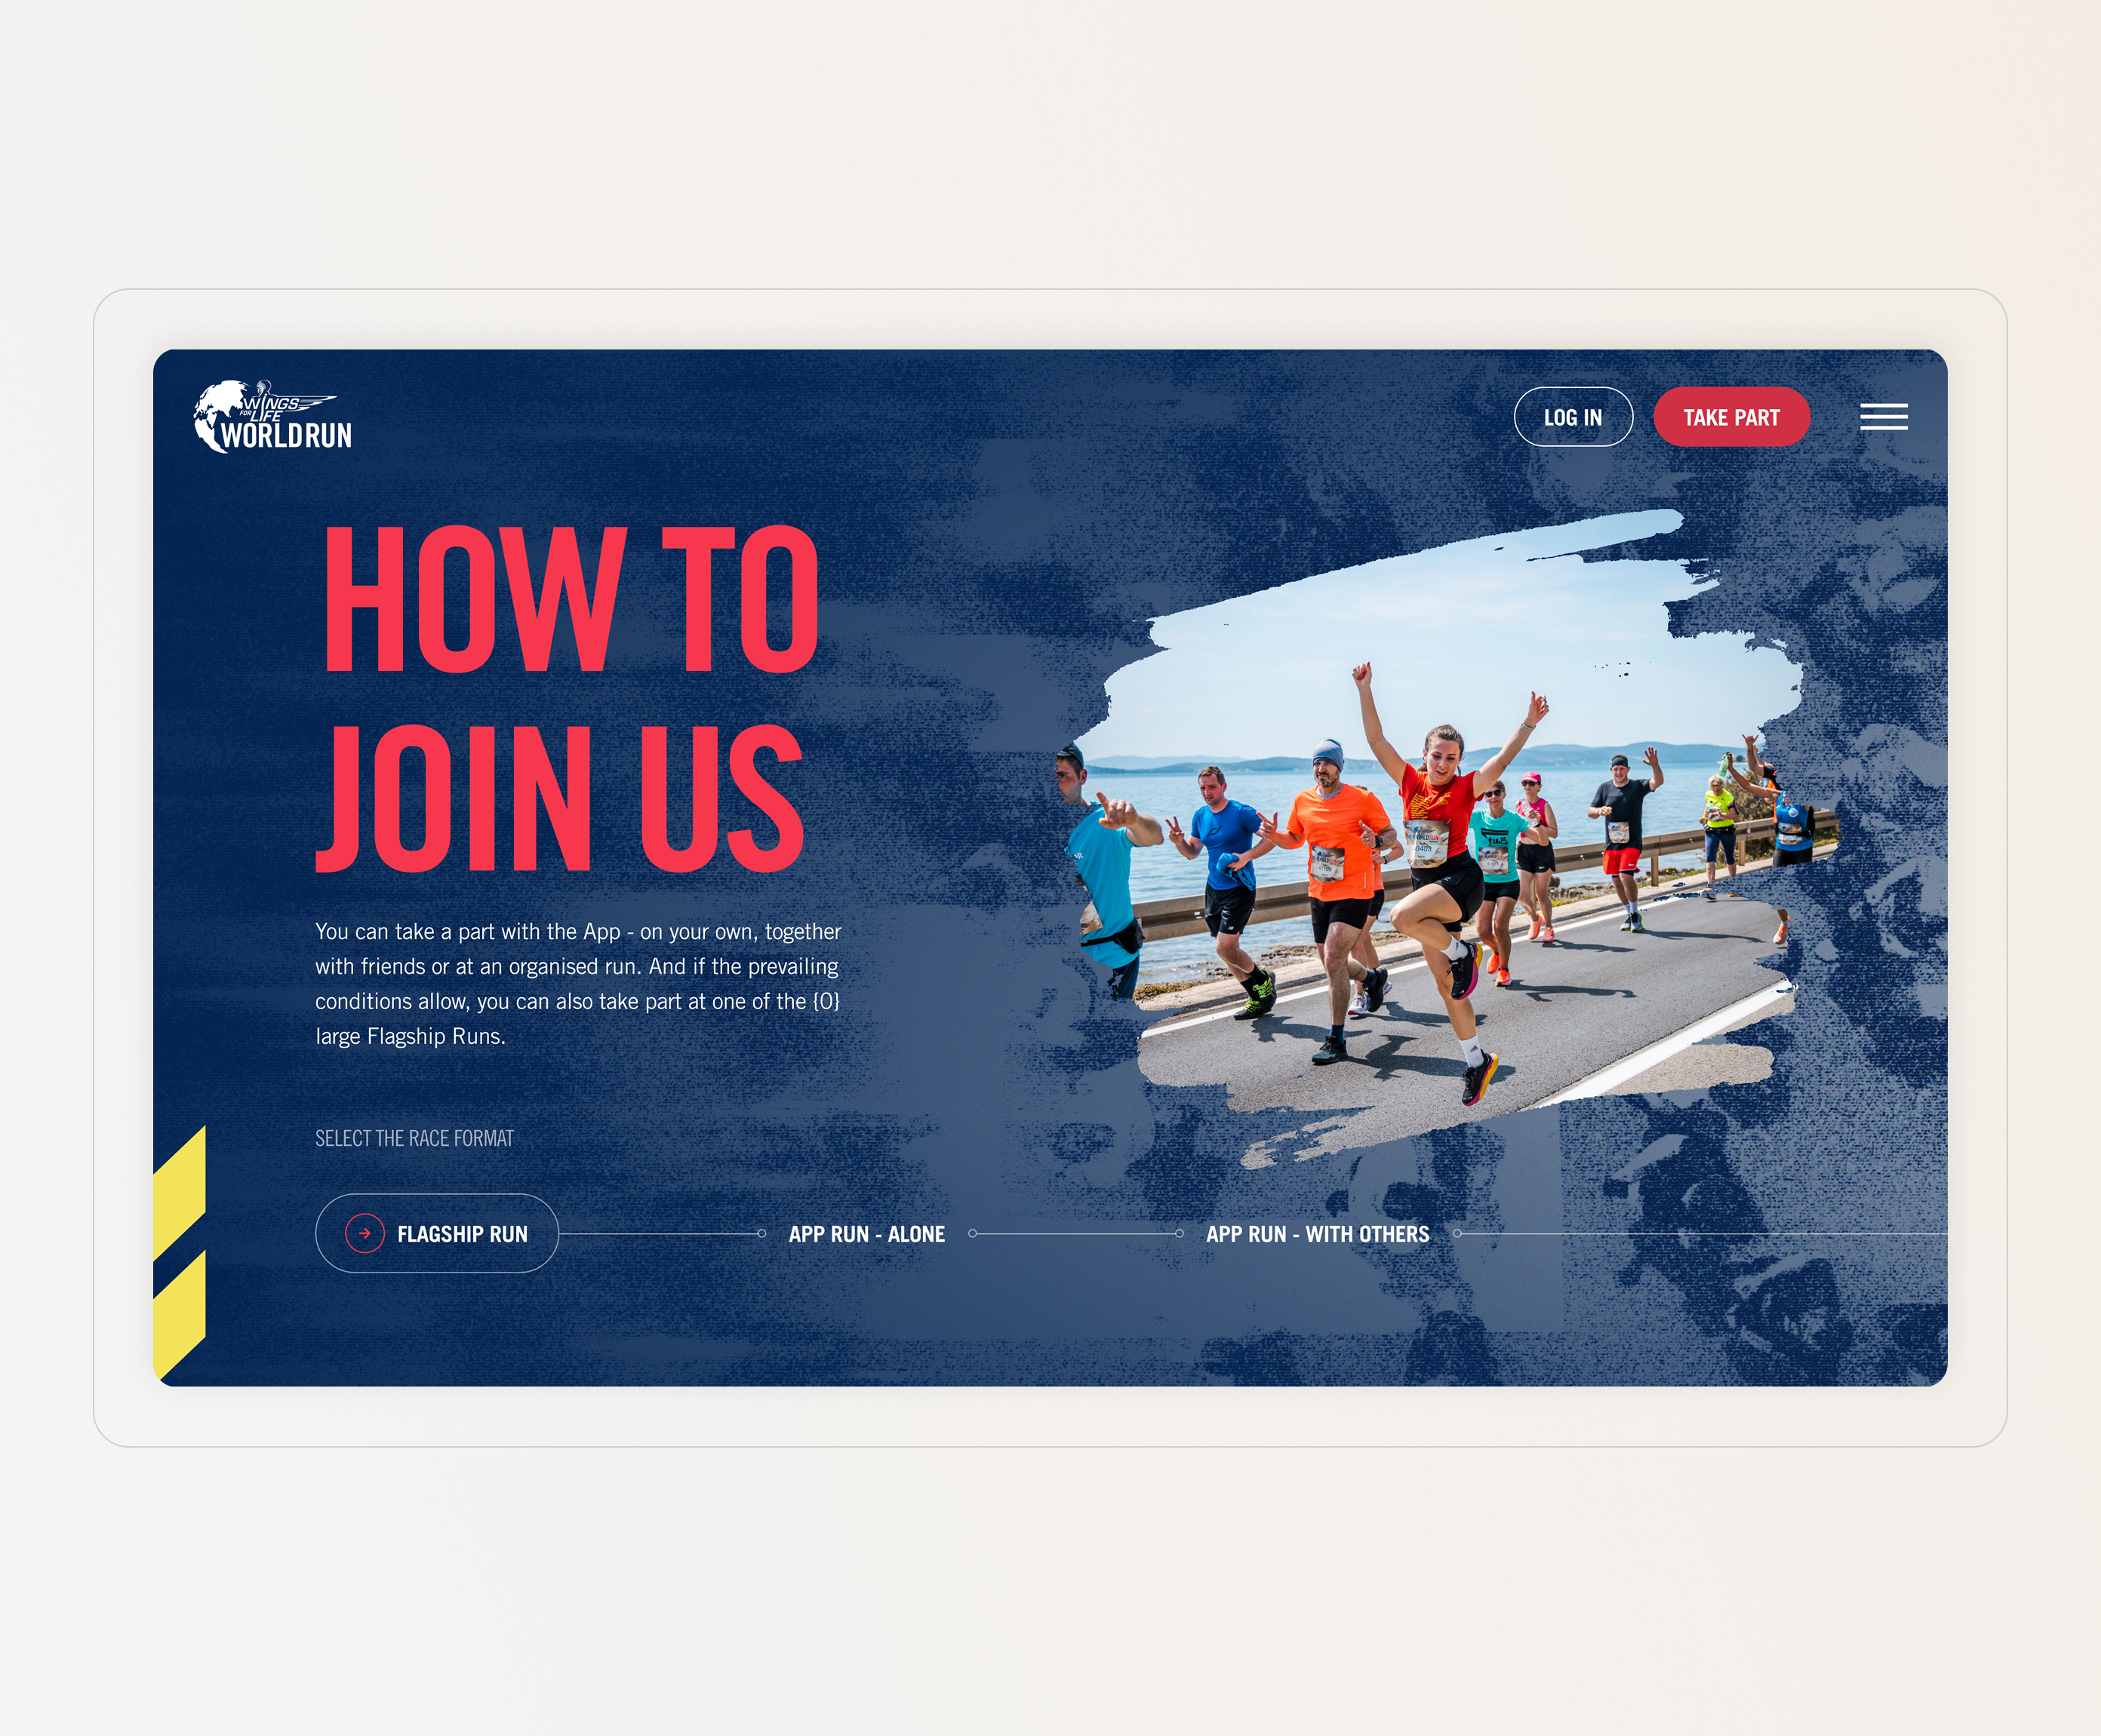
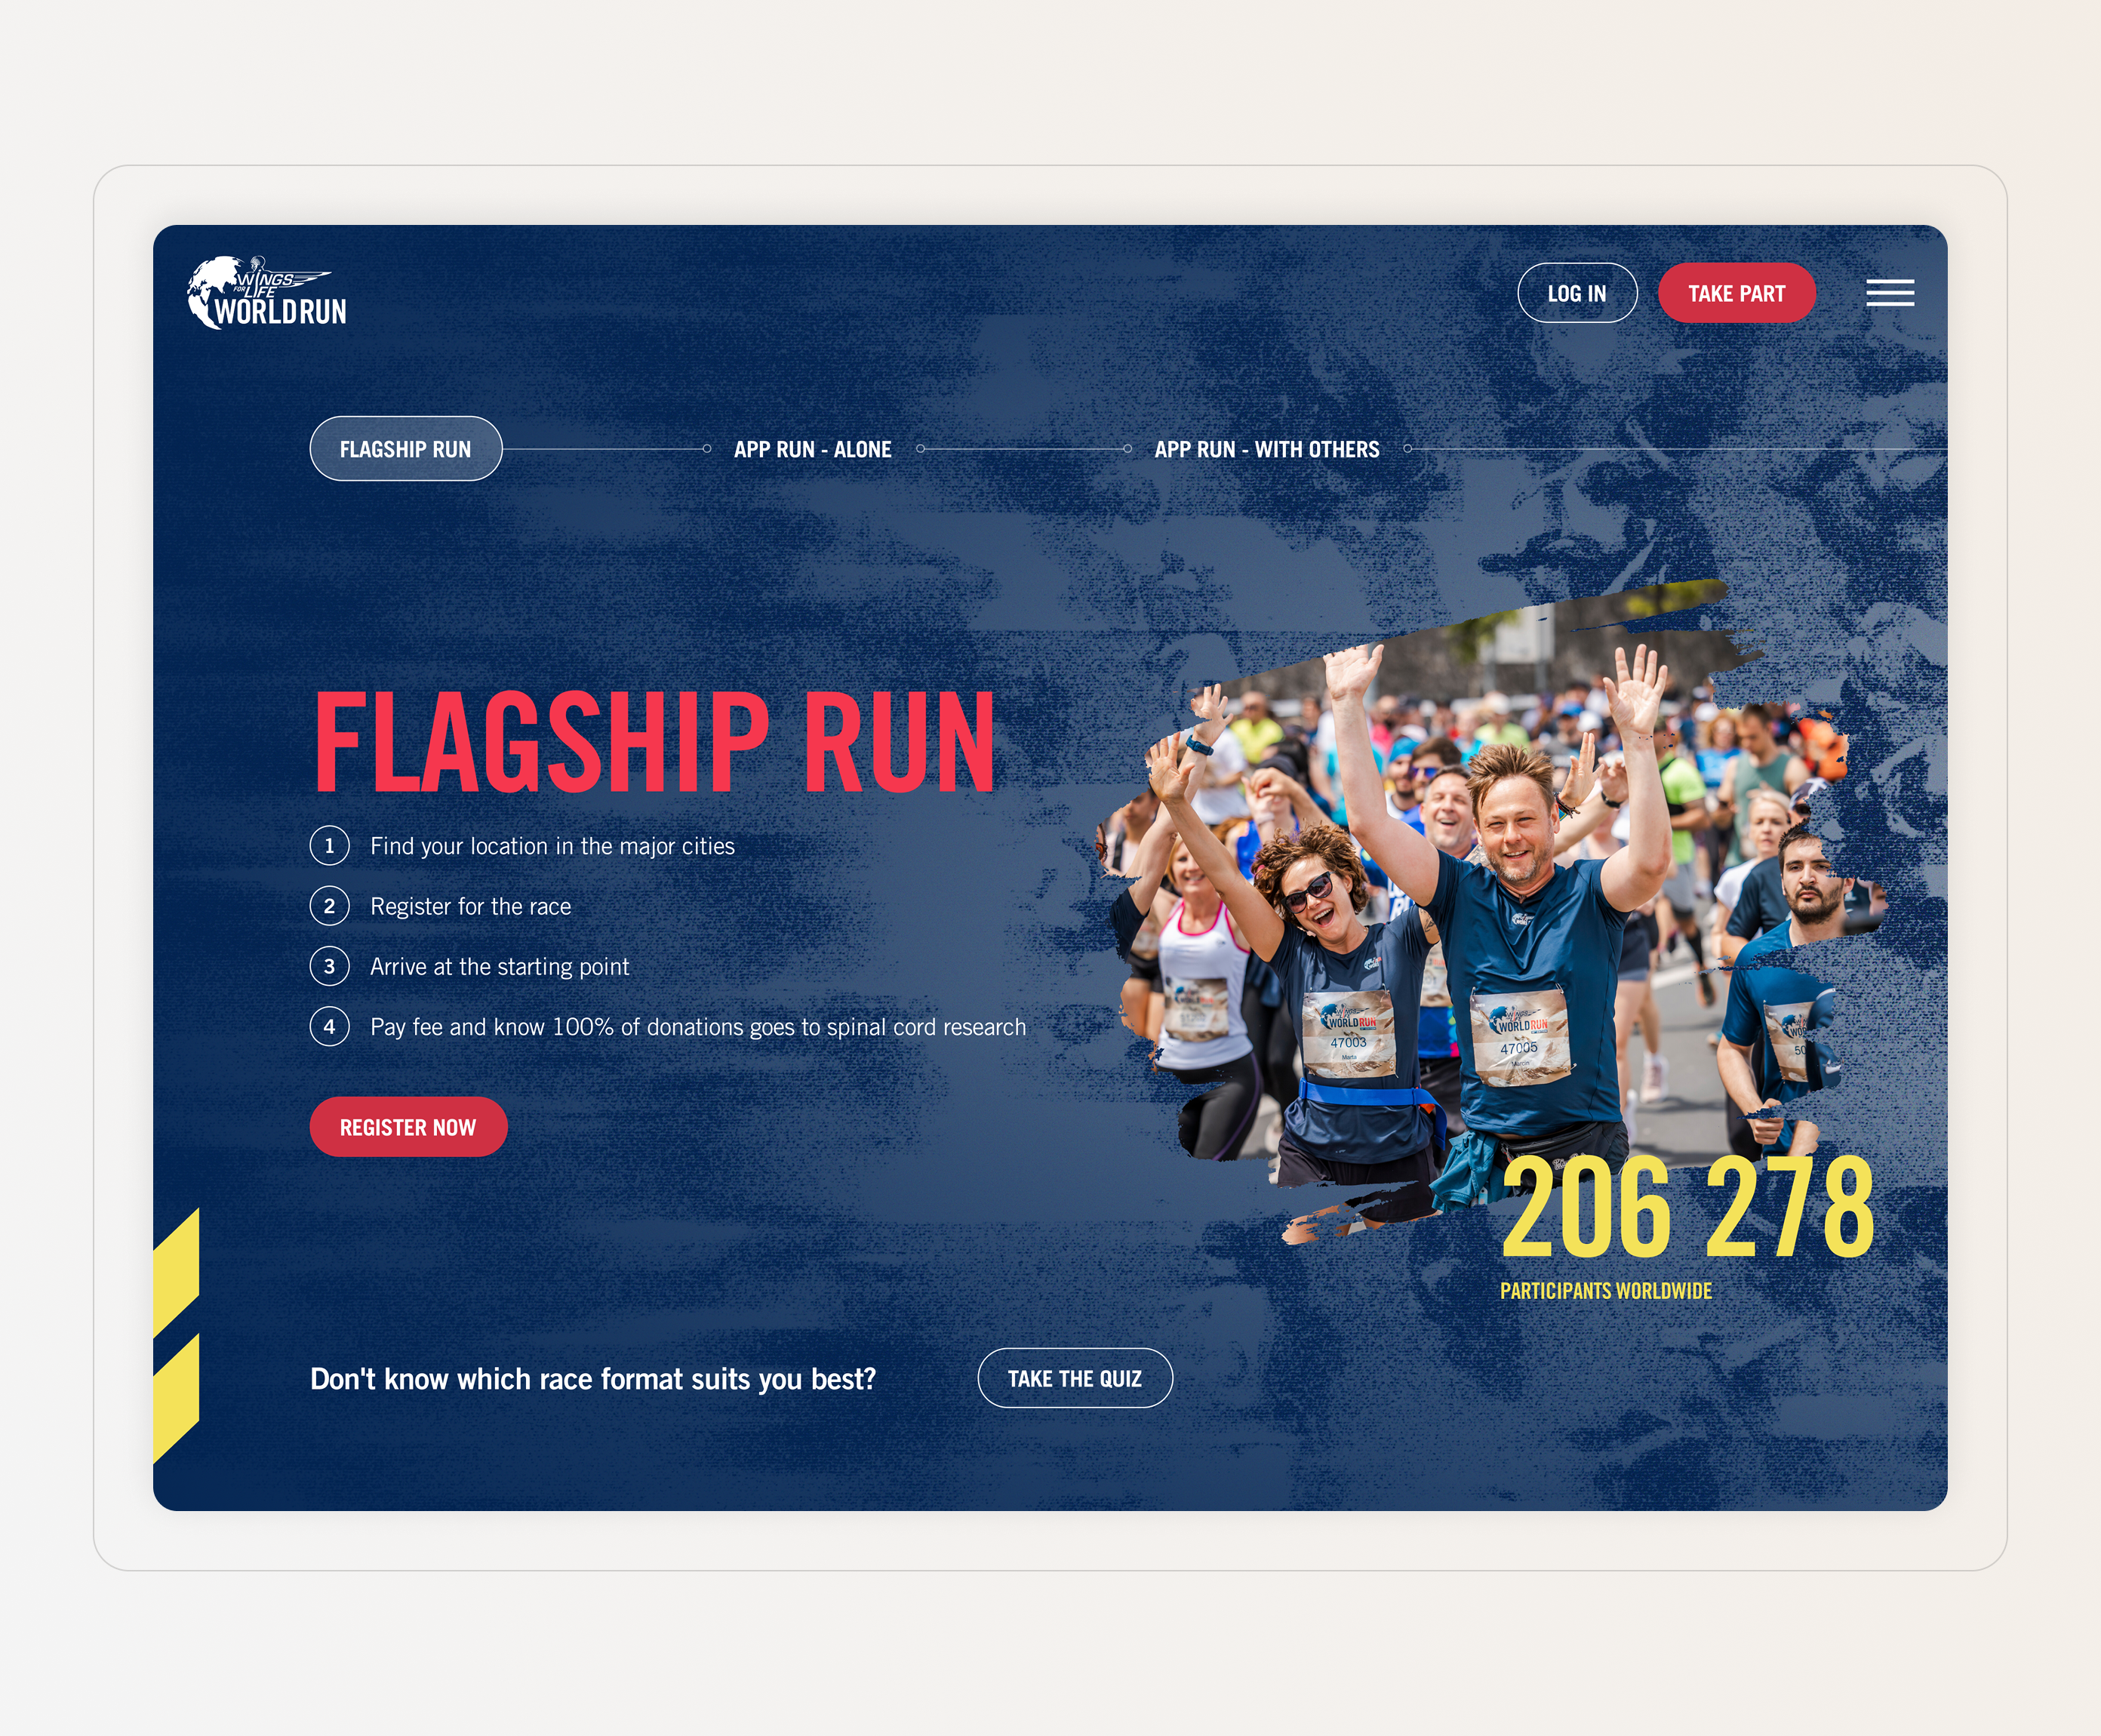
The first step was to develop several mood boards that captured a range of styles and explored different design directions based on the selected ideas. From these, I created three distinct concepts, each reflecting a unique approach to page navigation, with varying color palettes and typography. The primary focus, however, was on the visual elements—highlighting the race participants and clearly conveying the core idea of the project.
Concept 1
Concept 2
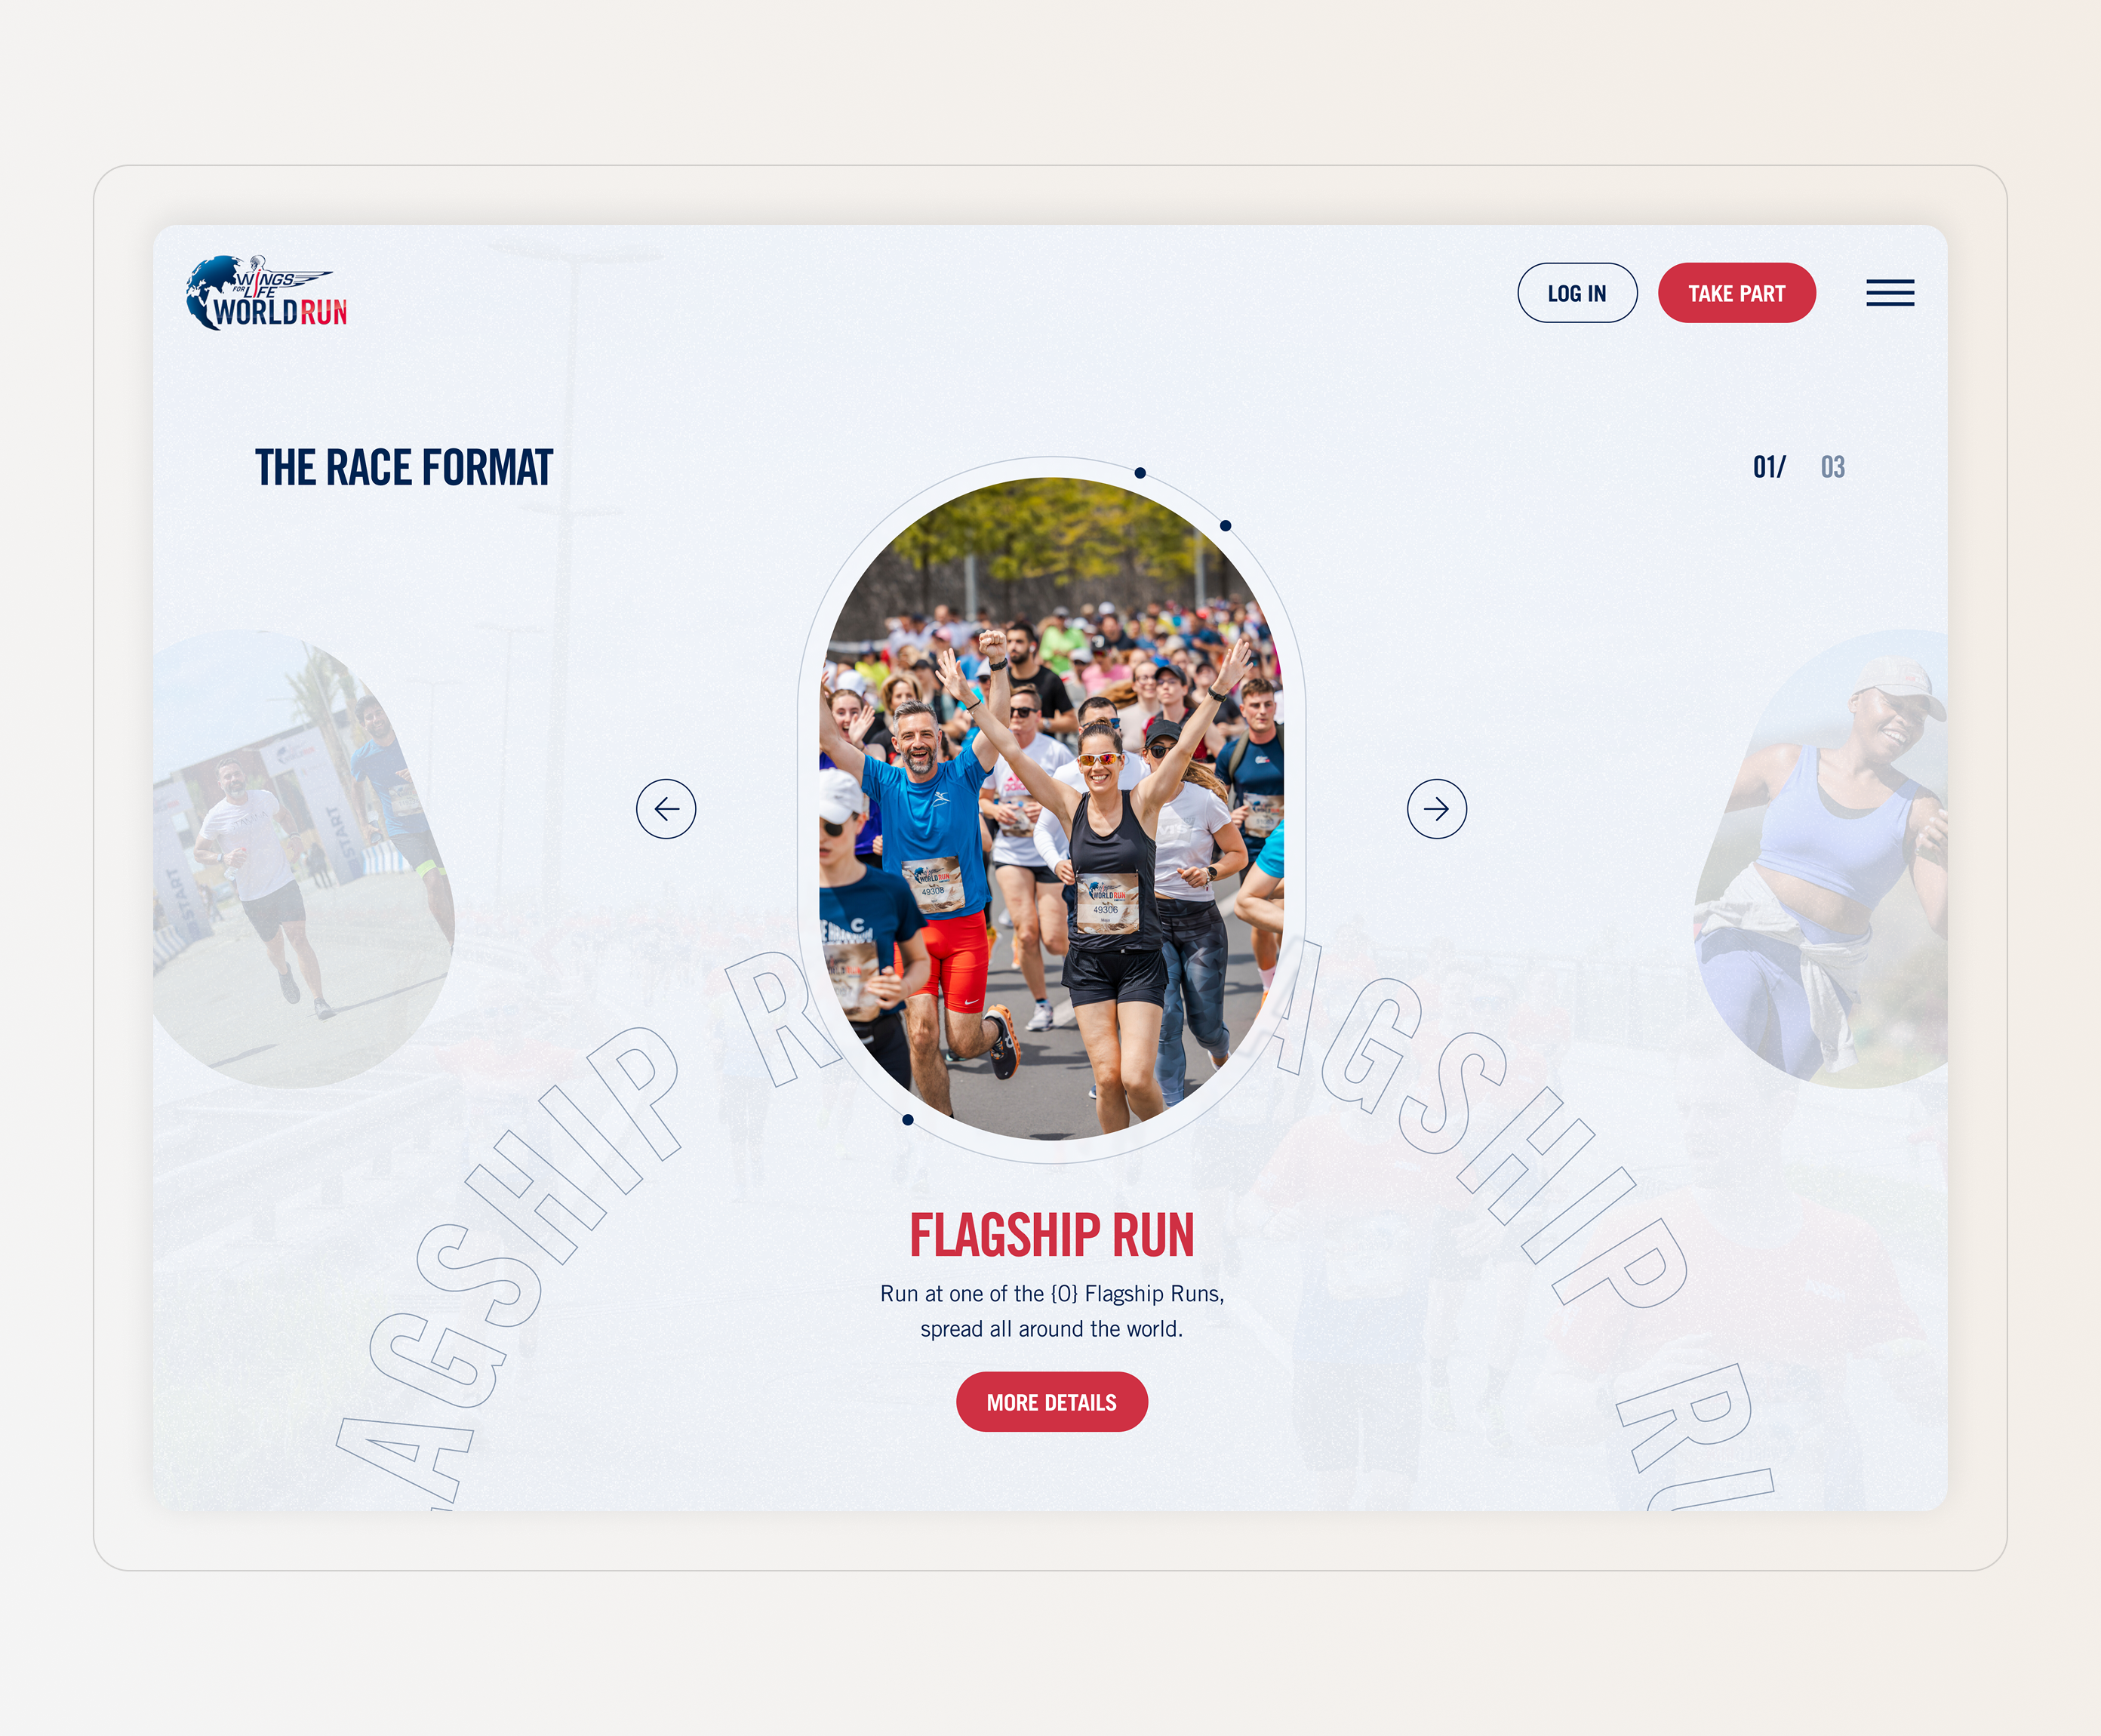
Concept 3
Final Design, Home page
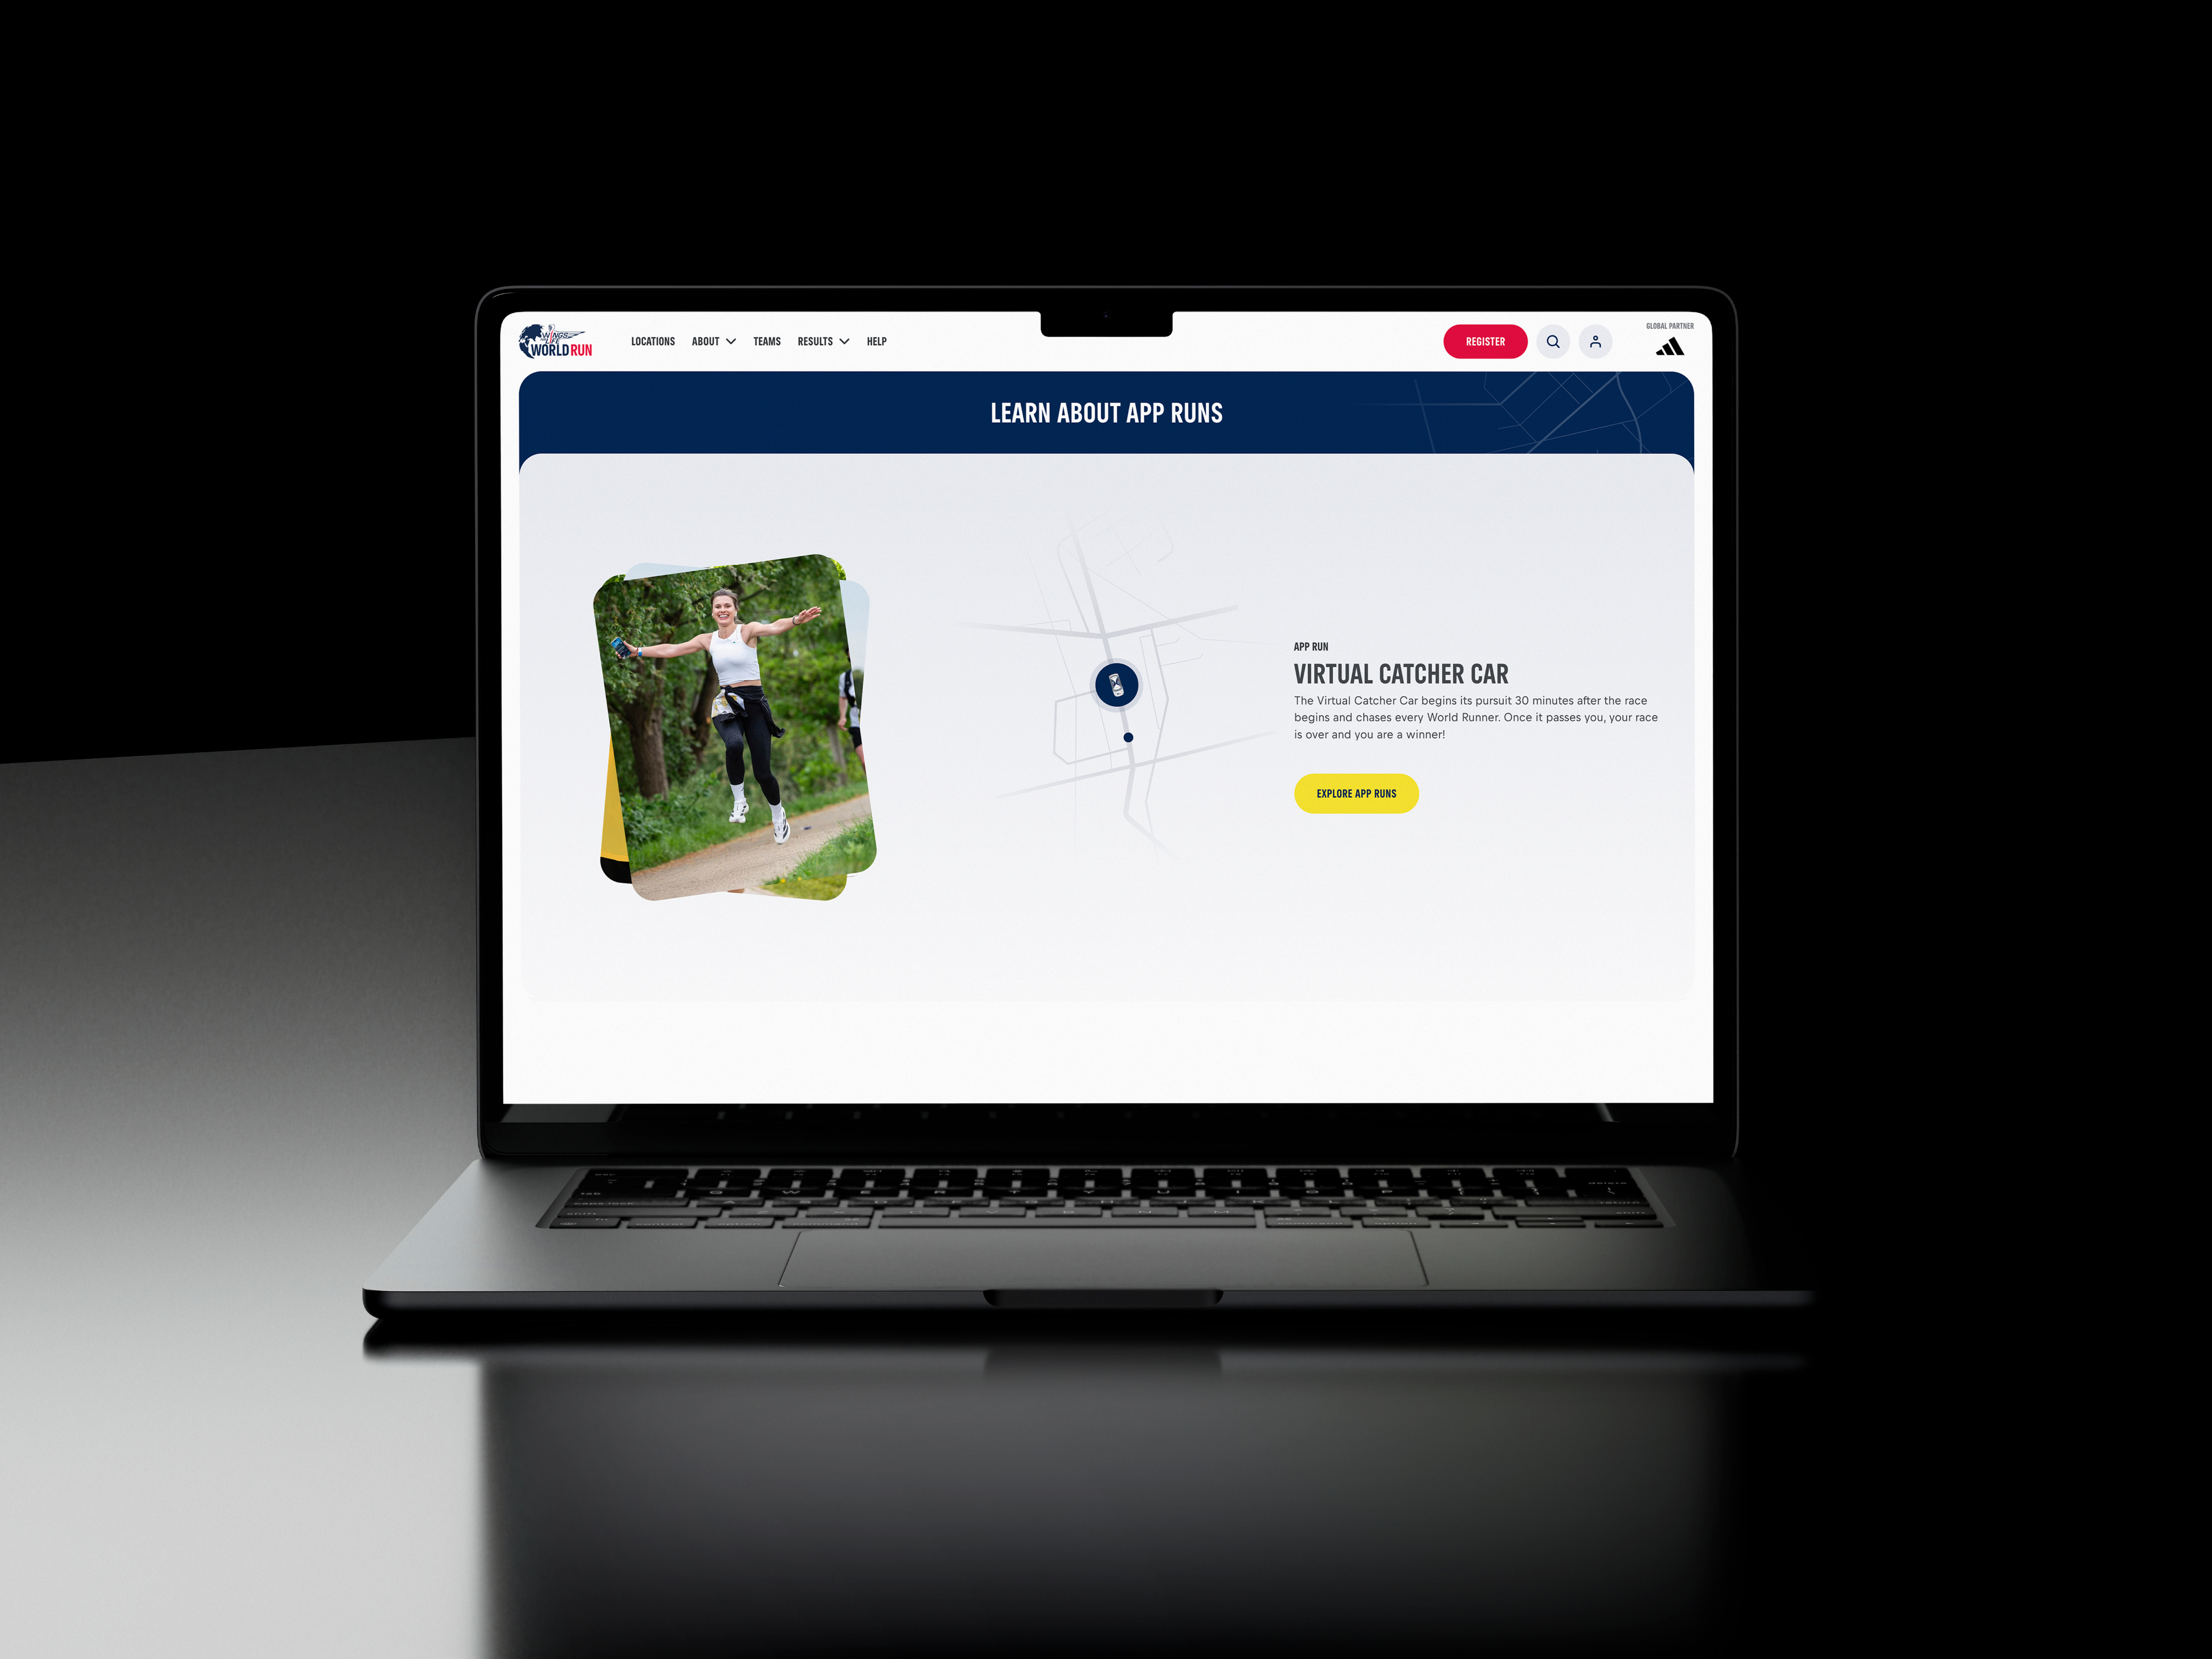
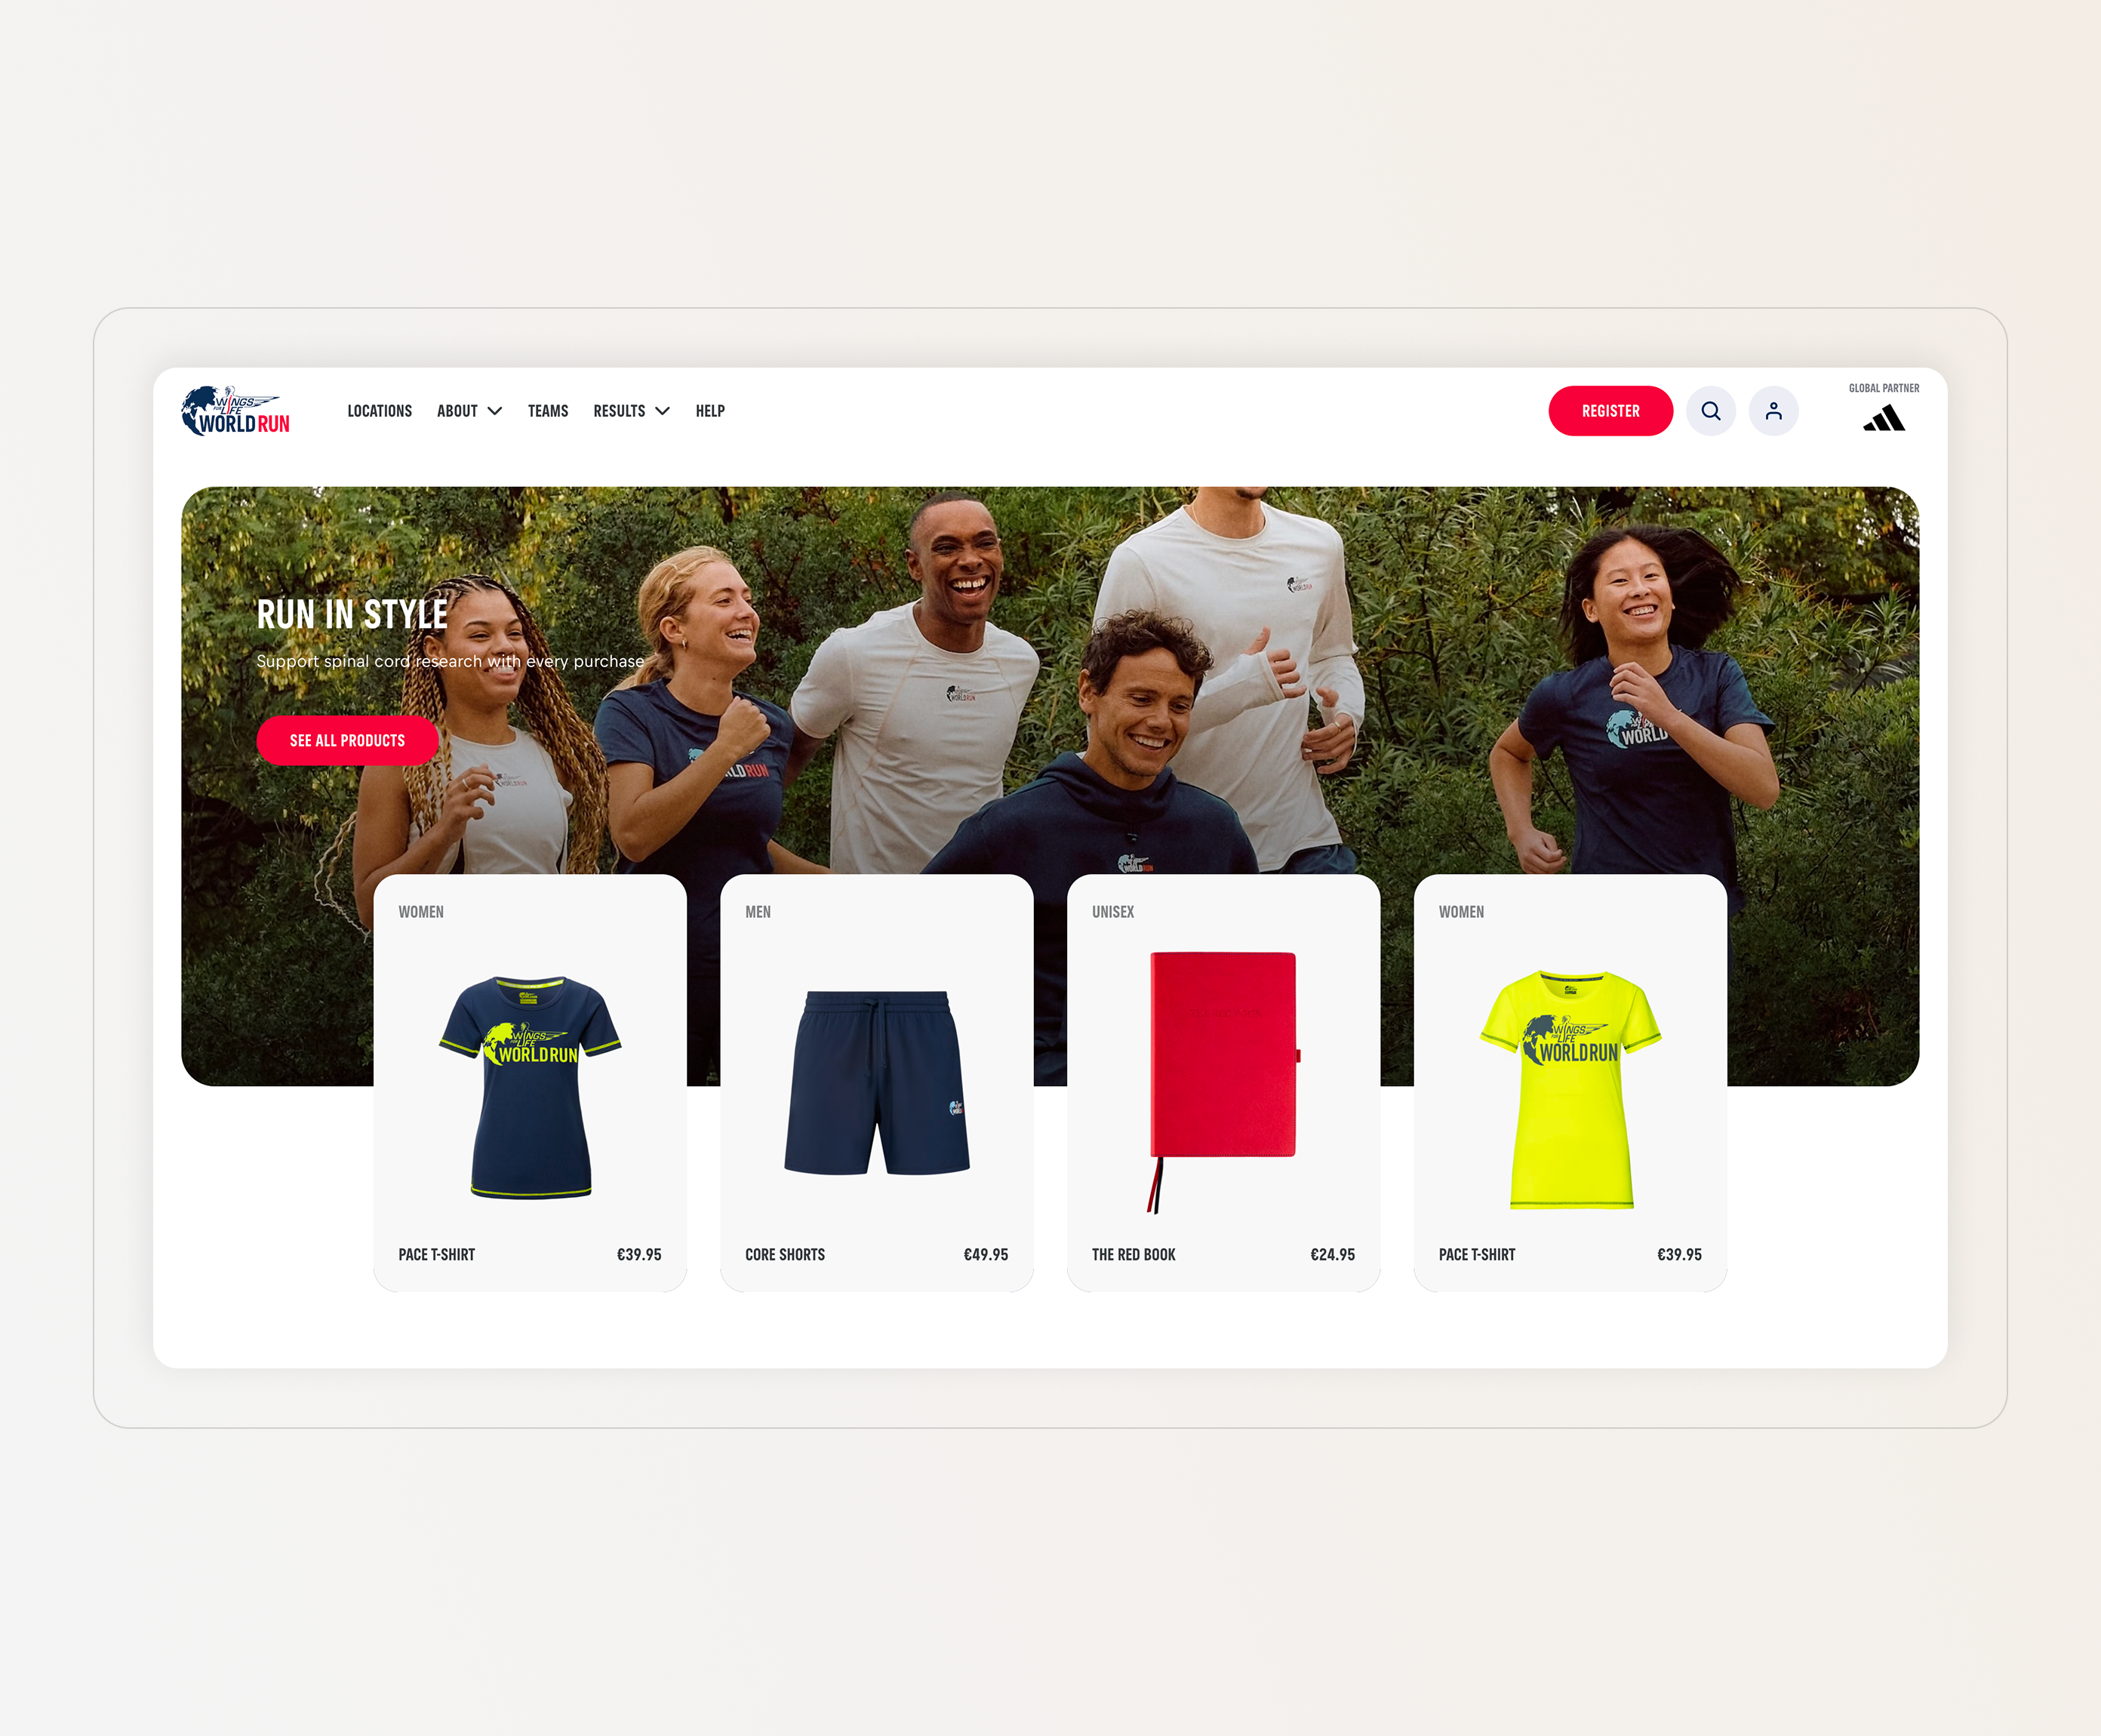
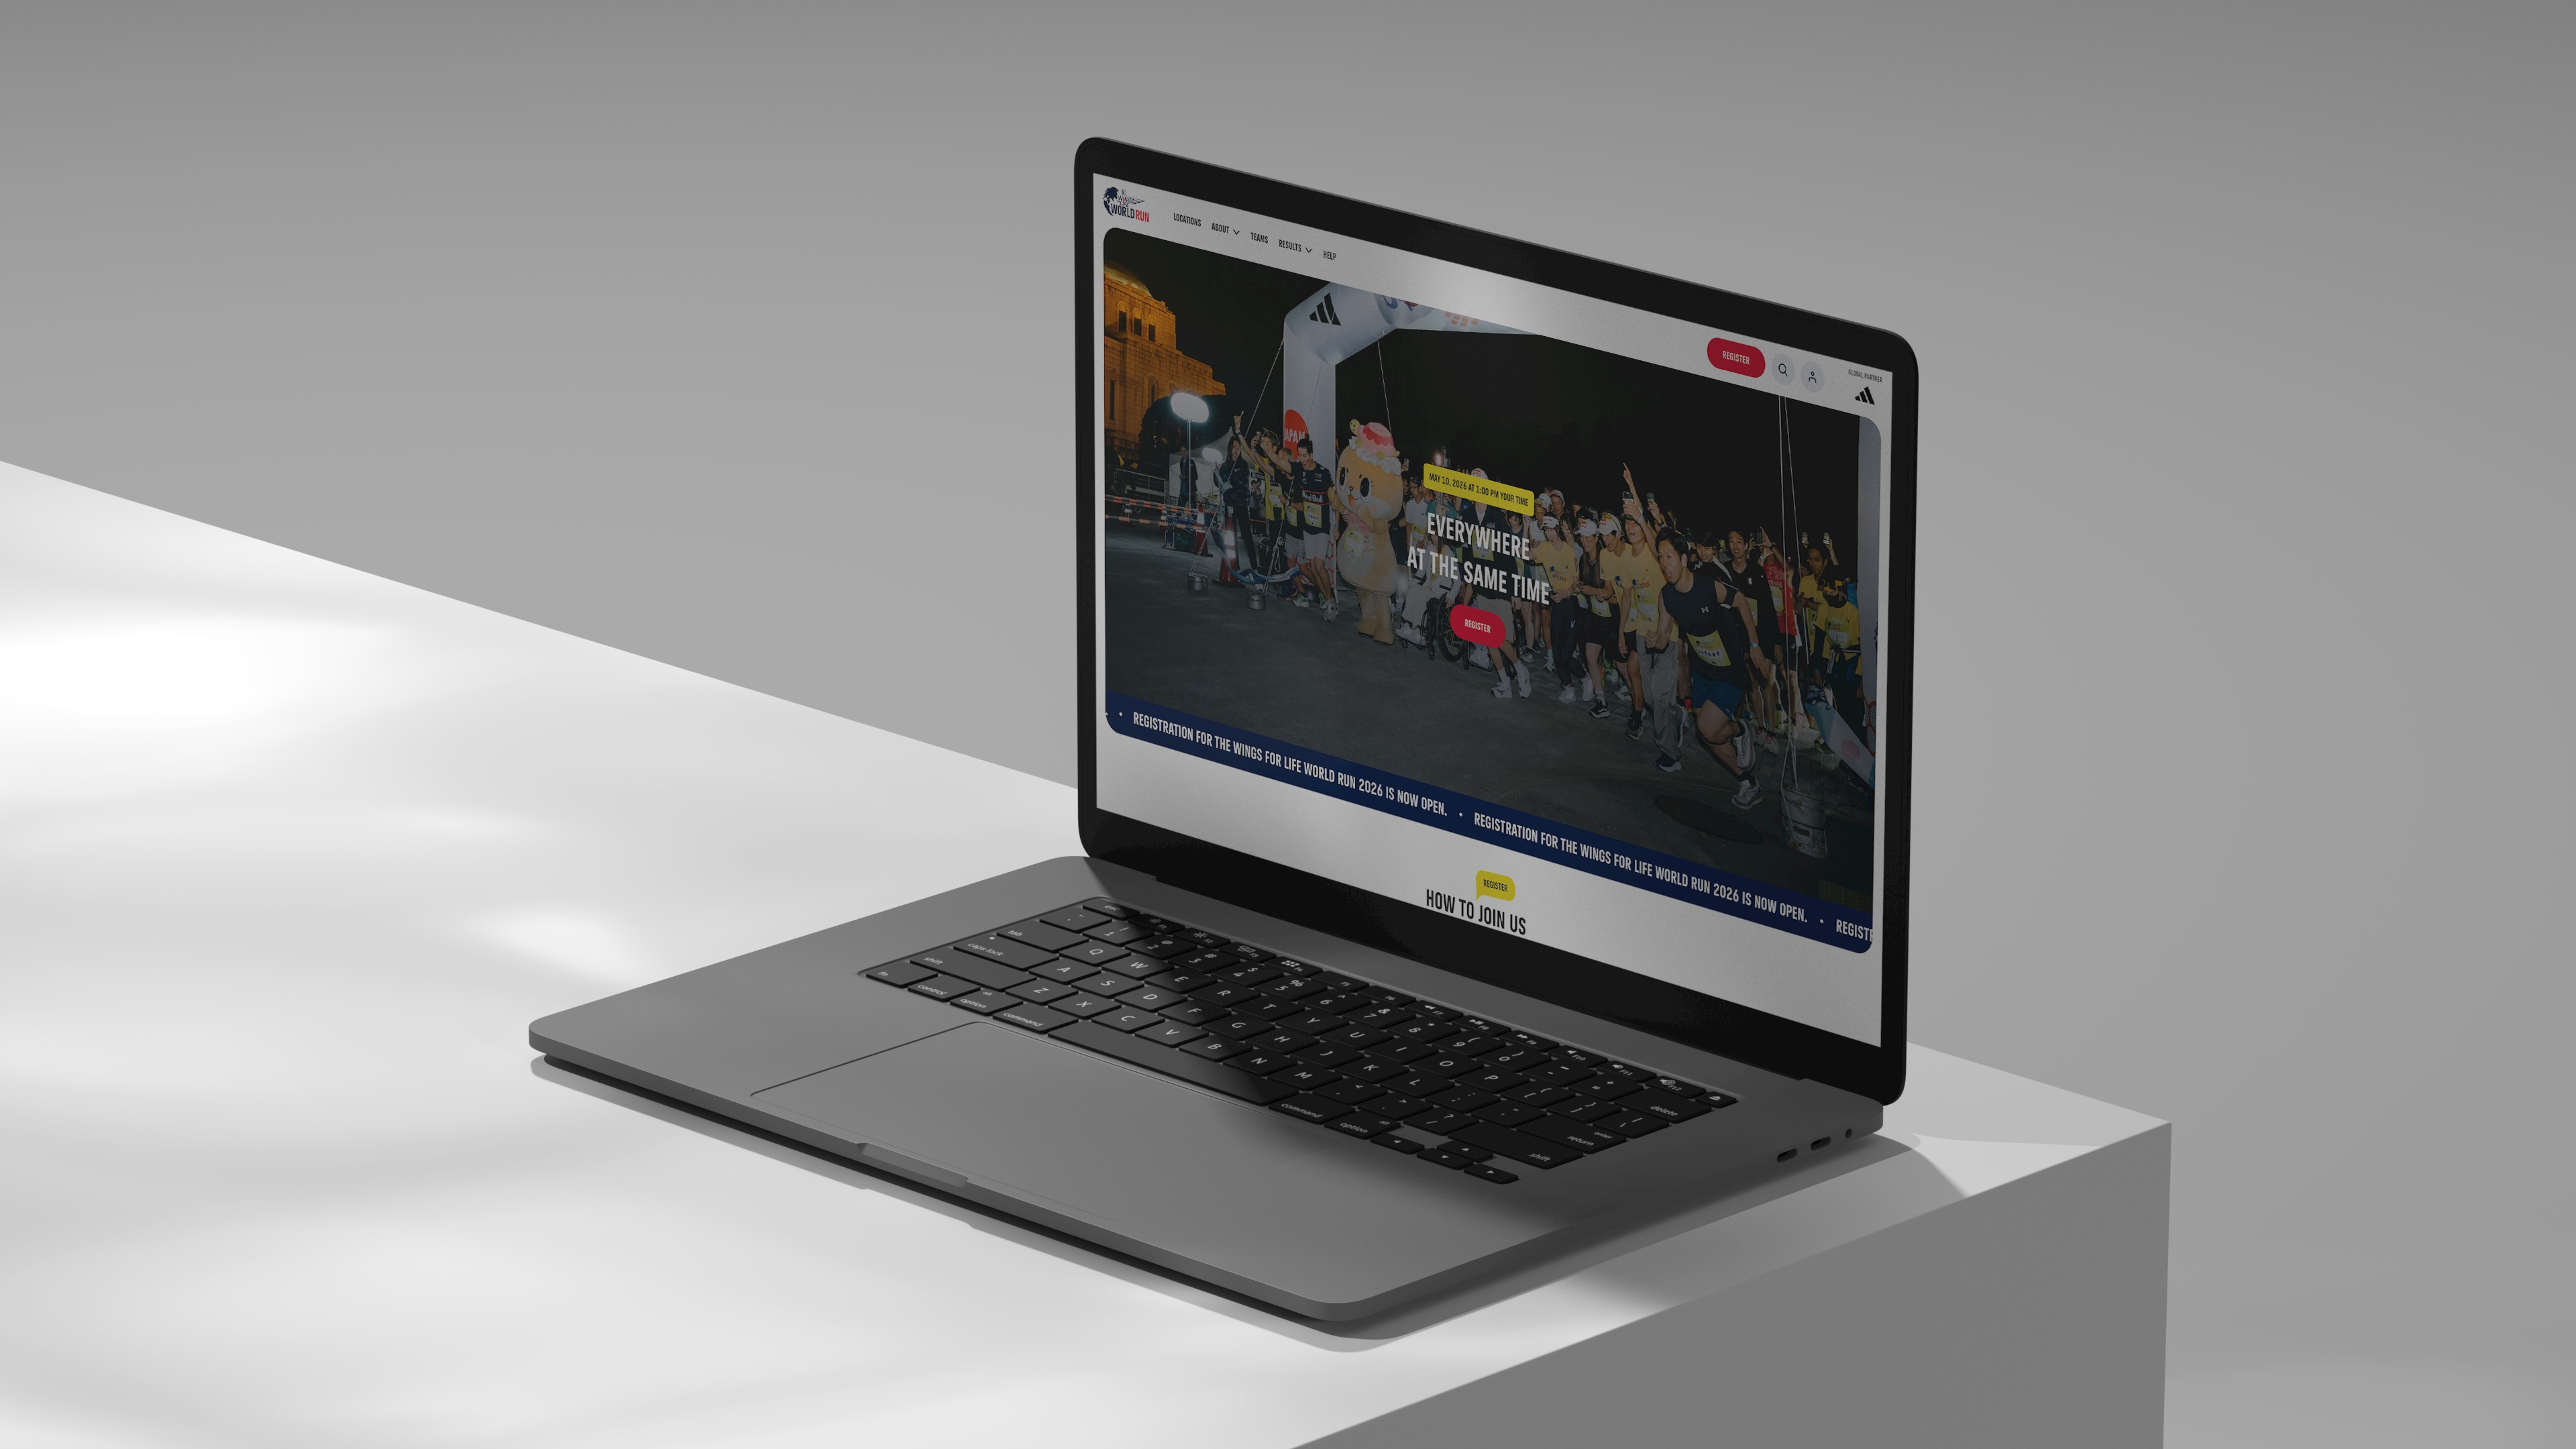
After reviewing the concepts, the client defined the main direction for the design. The final homepage was then developed using road-inspired elements and a car visualization as key components. Various micro-interactions were also introduced across scroll sections—for example, subtle image movements and hover effects on data sections, event cards, and store products. These dynamic elements made the site feel more engaging and lively, helping to capture and retain users’ attention.
Additional emphasis was placed on the application itself, ensuring that each participant can quickly join an active race or stay updated with the latest news leading up to the event.
Locations
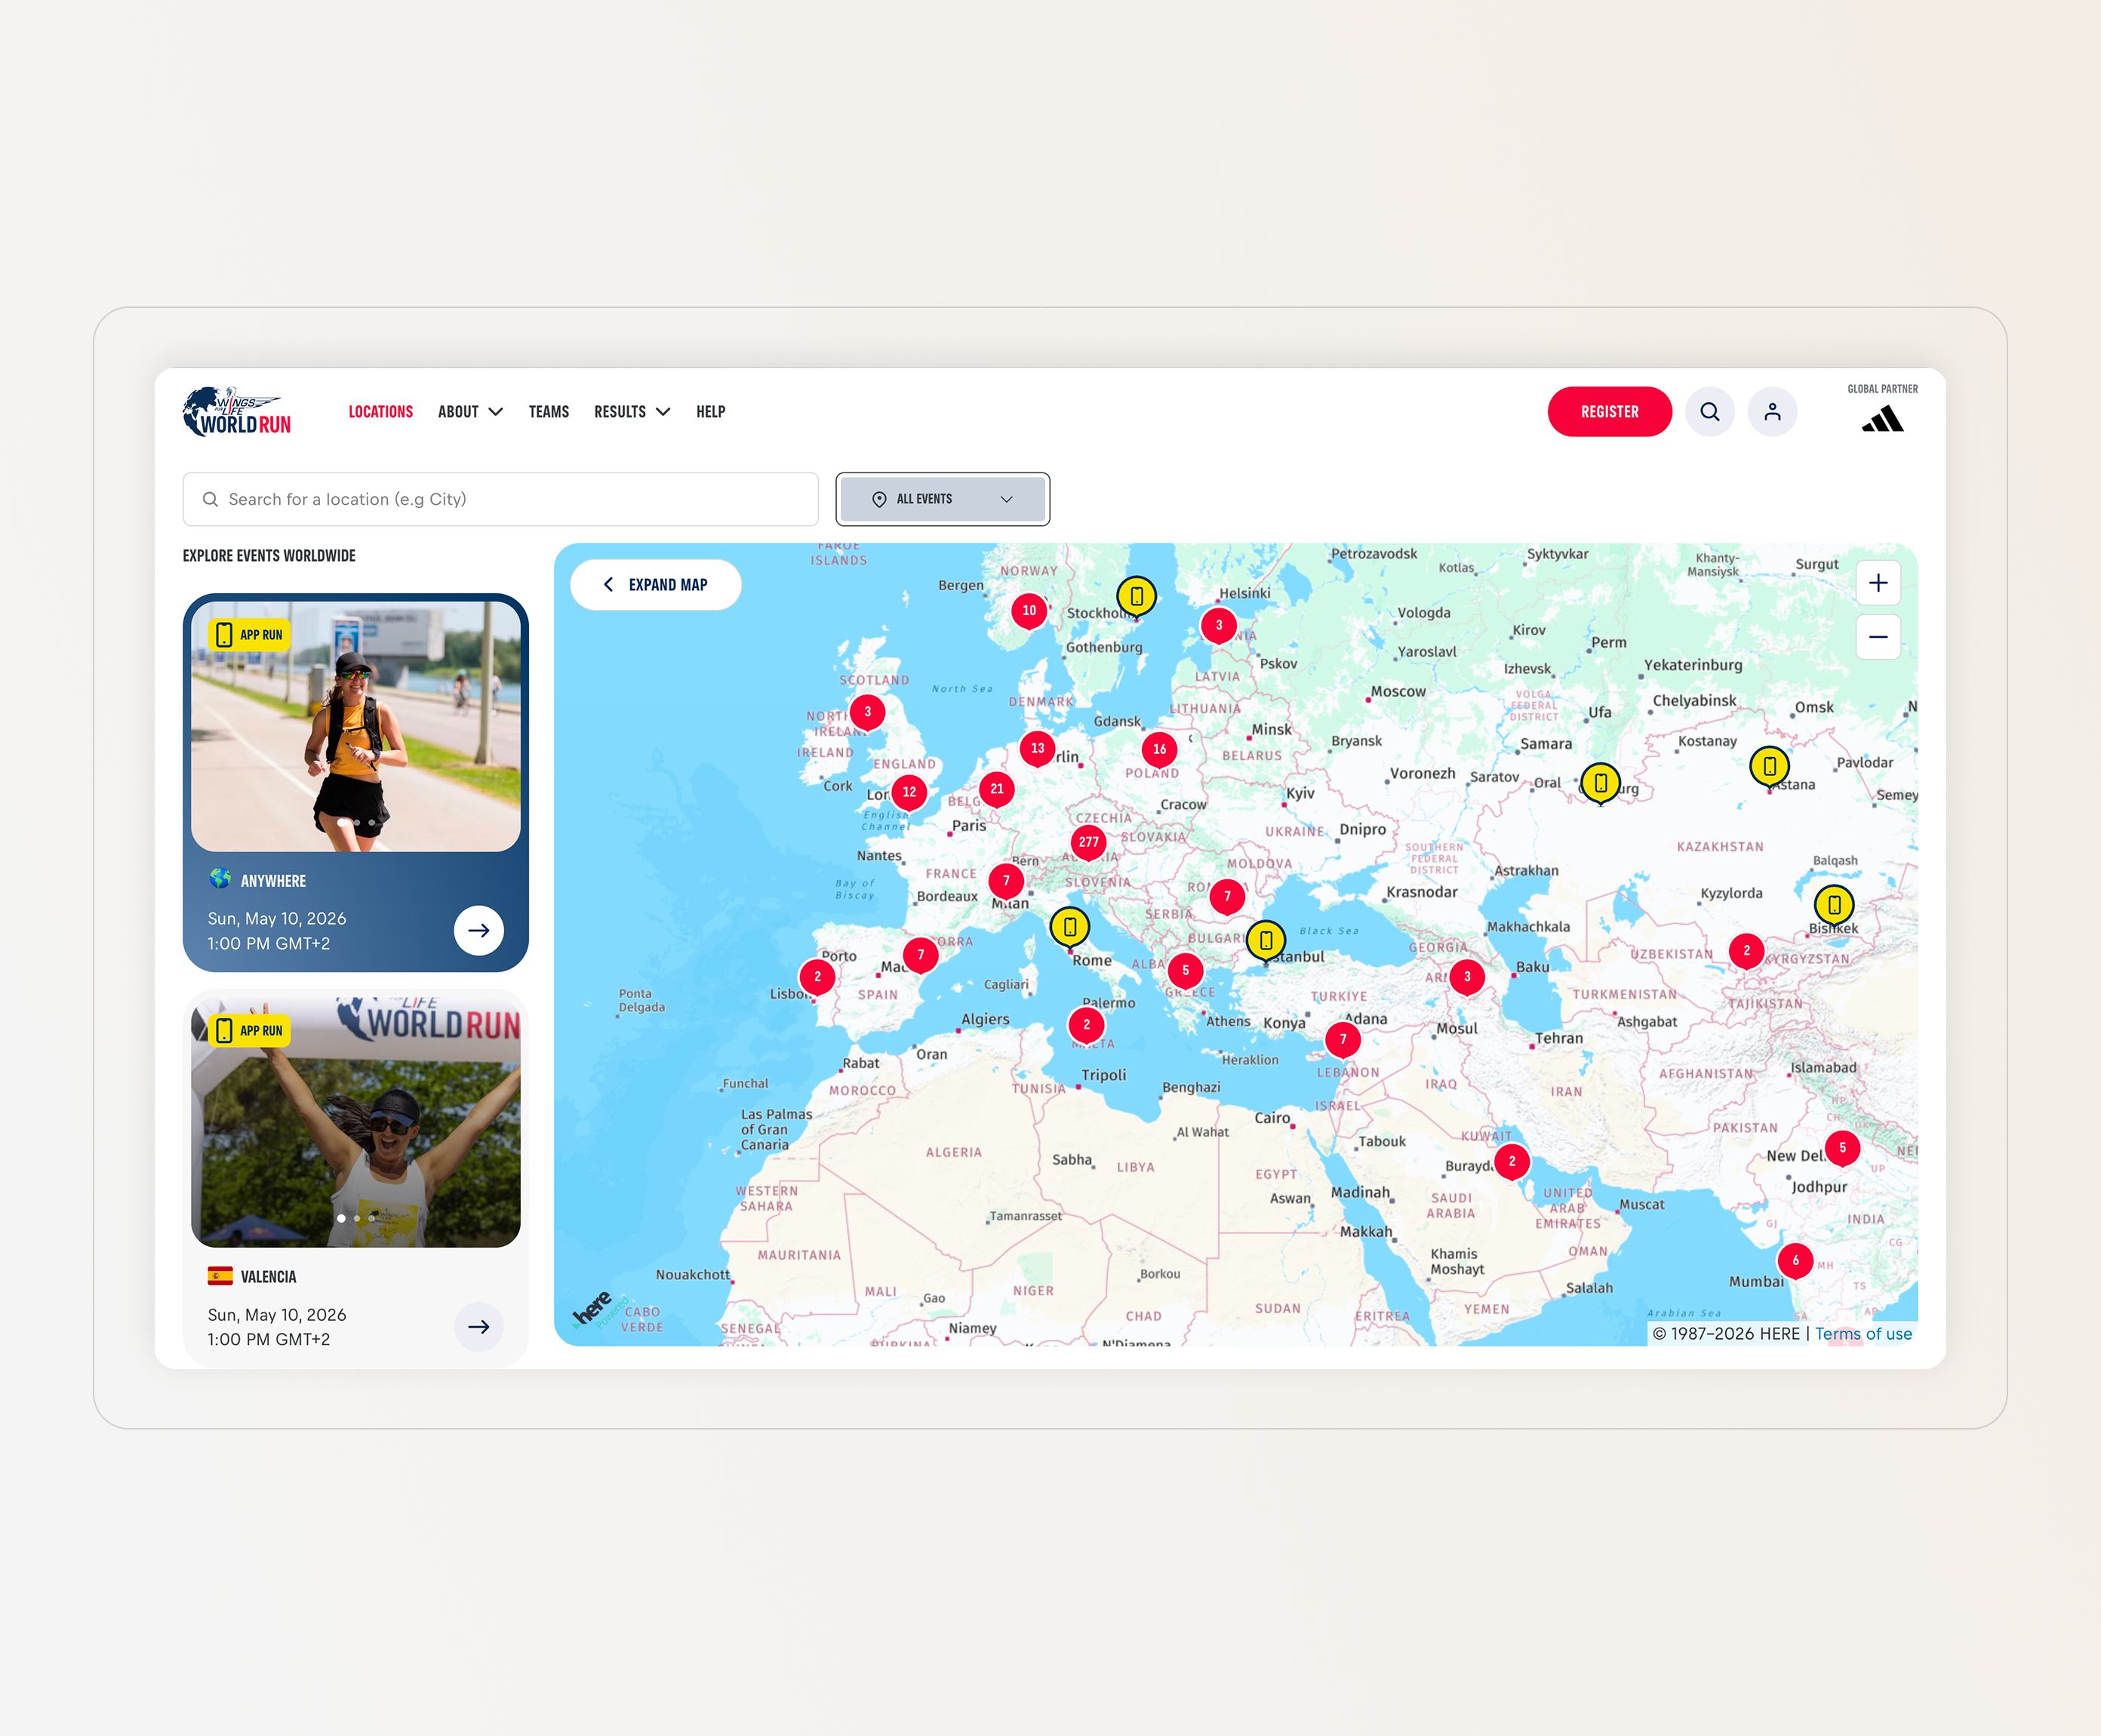
Because the race takes place globally, with participants running simultaneously around the world, it was essential to provide a comprehensive view of all available events. To achieve this, a dedicated location page was created featuring a large interactive map alongside a structured list of races.
The race closest to the user’s location is prioritized at the top of the page. Additional search and filtering options were implemented to ensure quick and intuitive navigation.
Details page
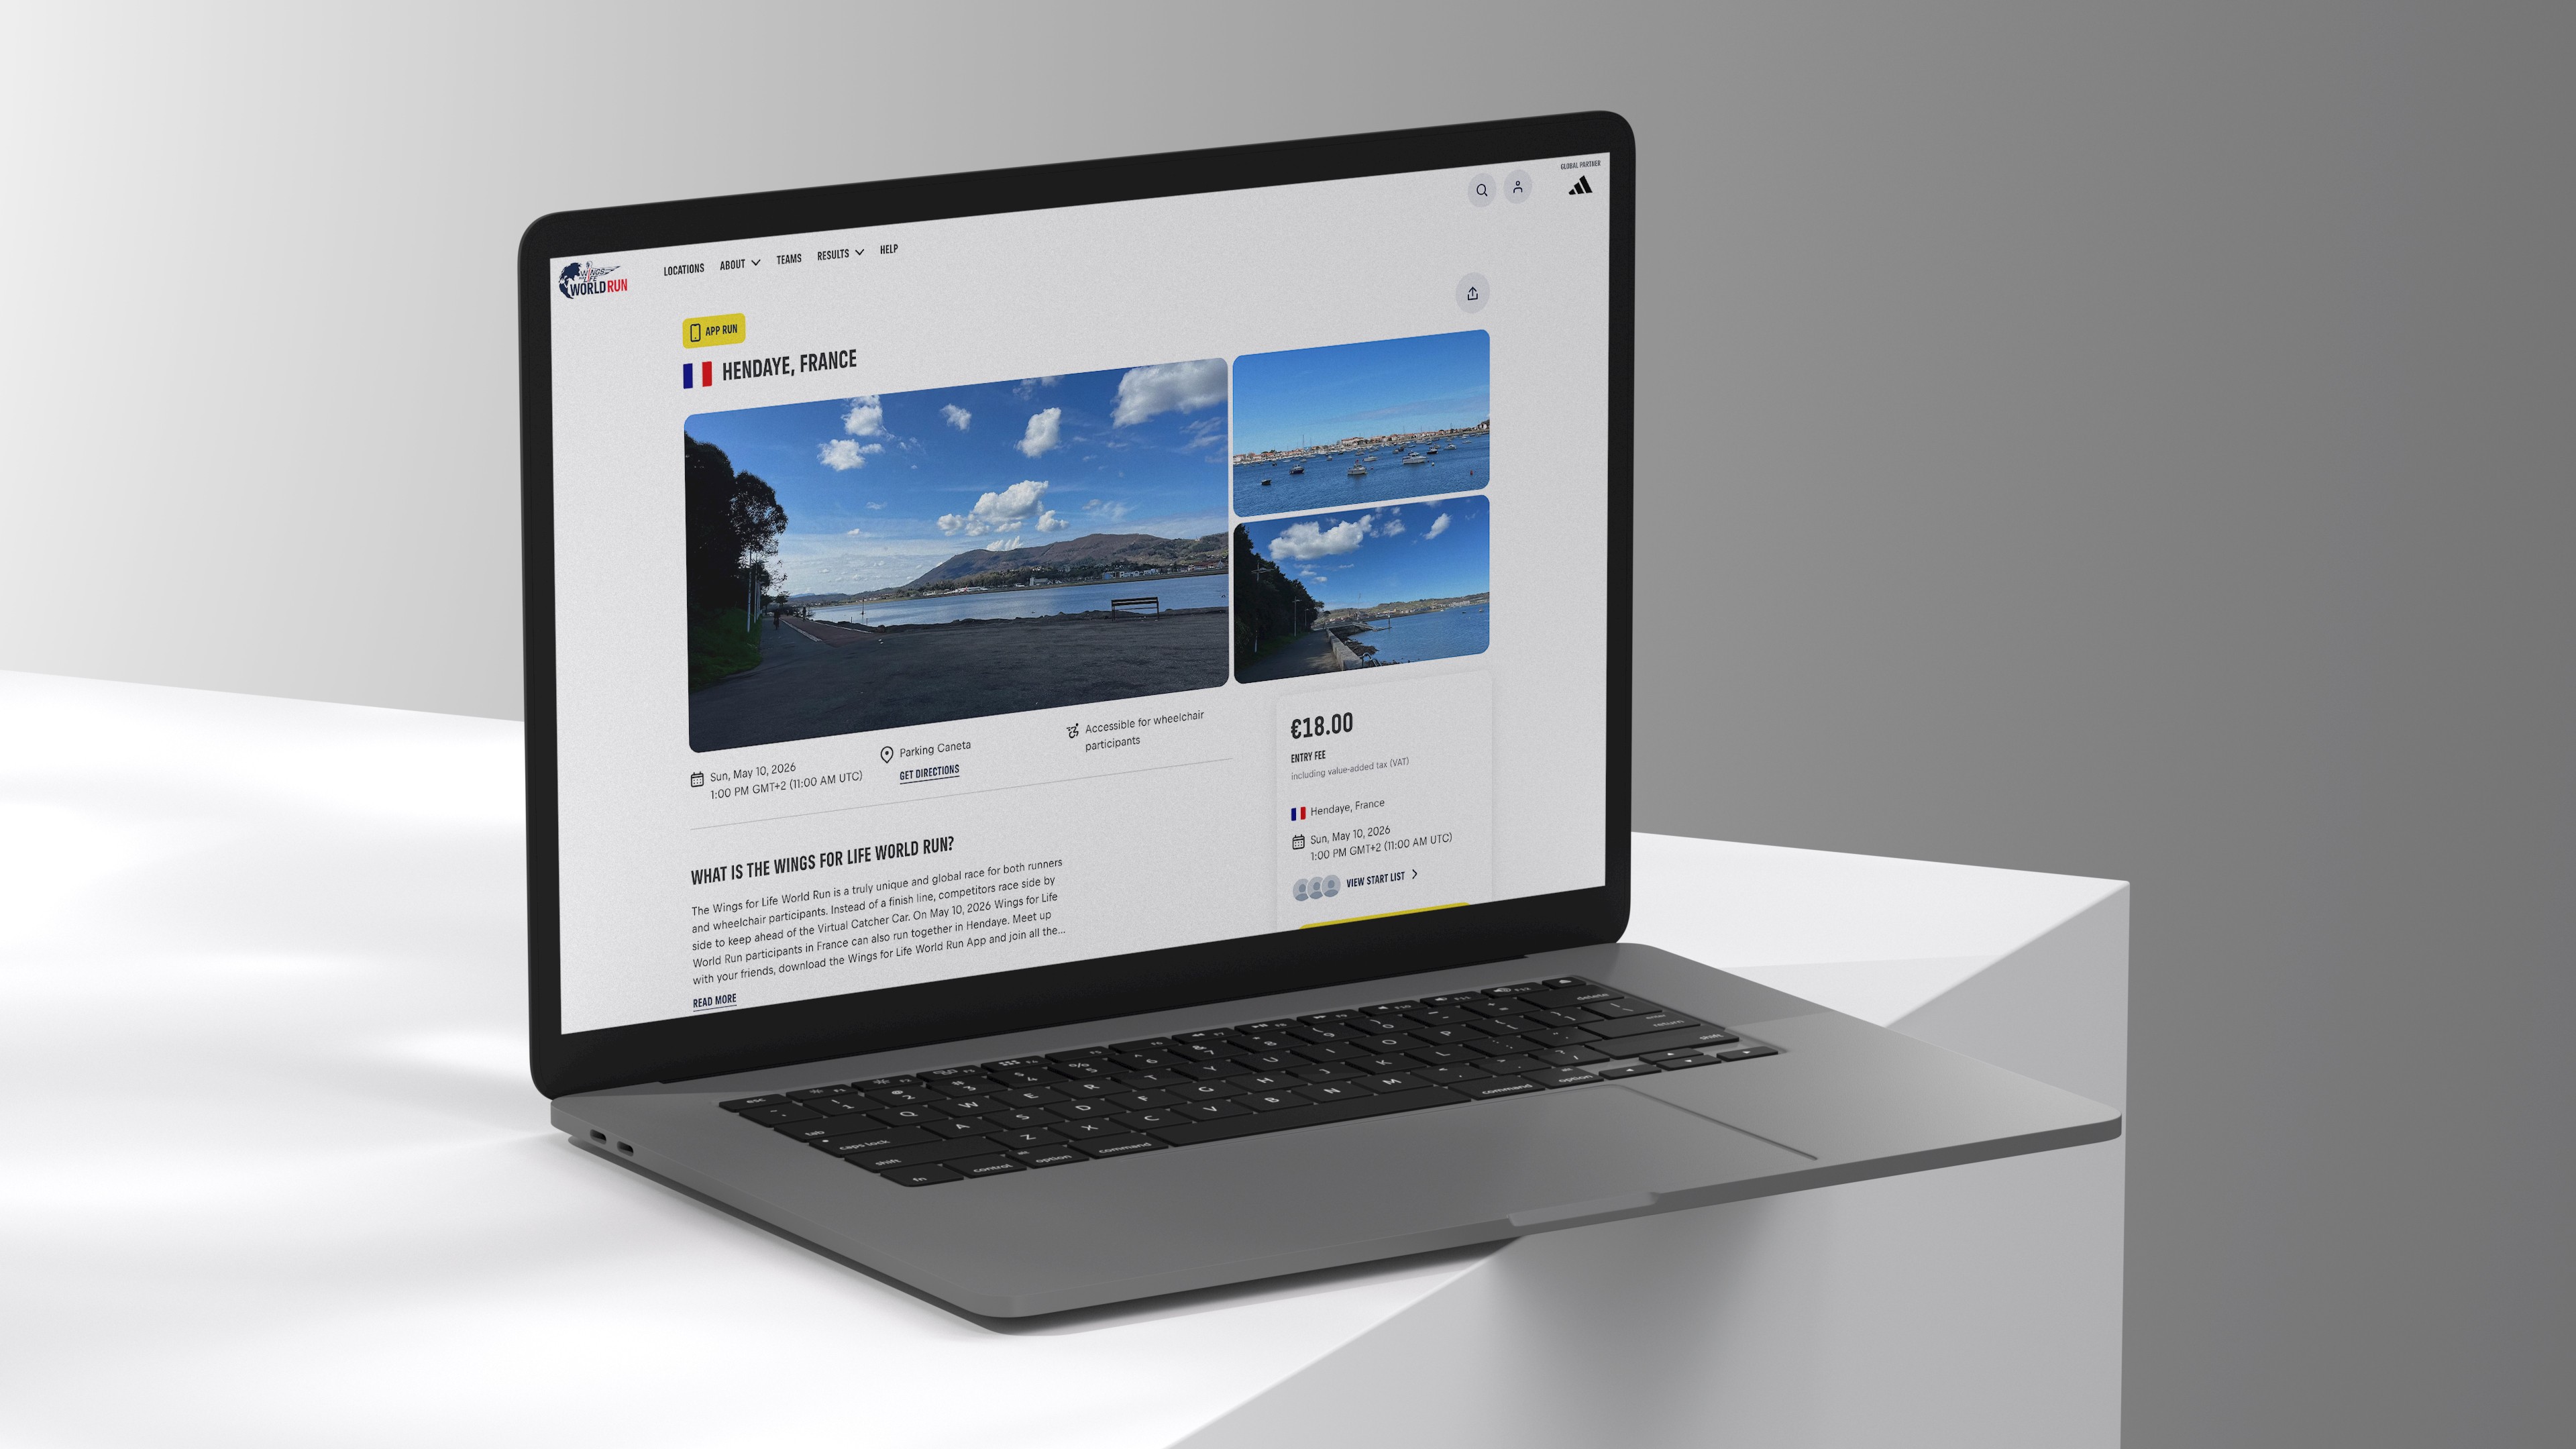
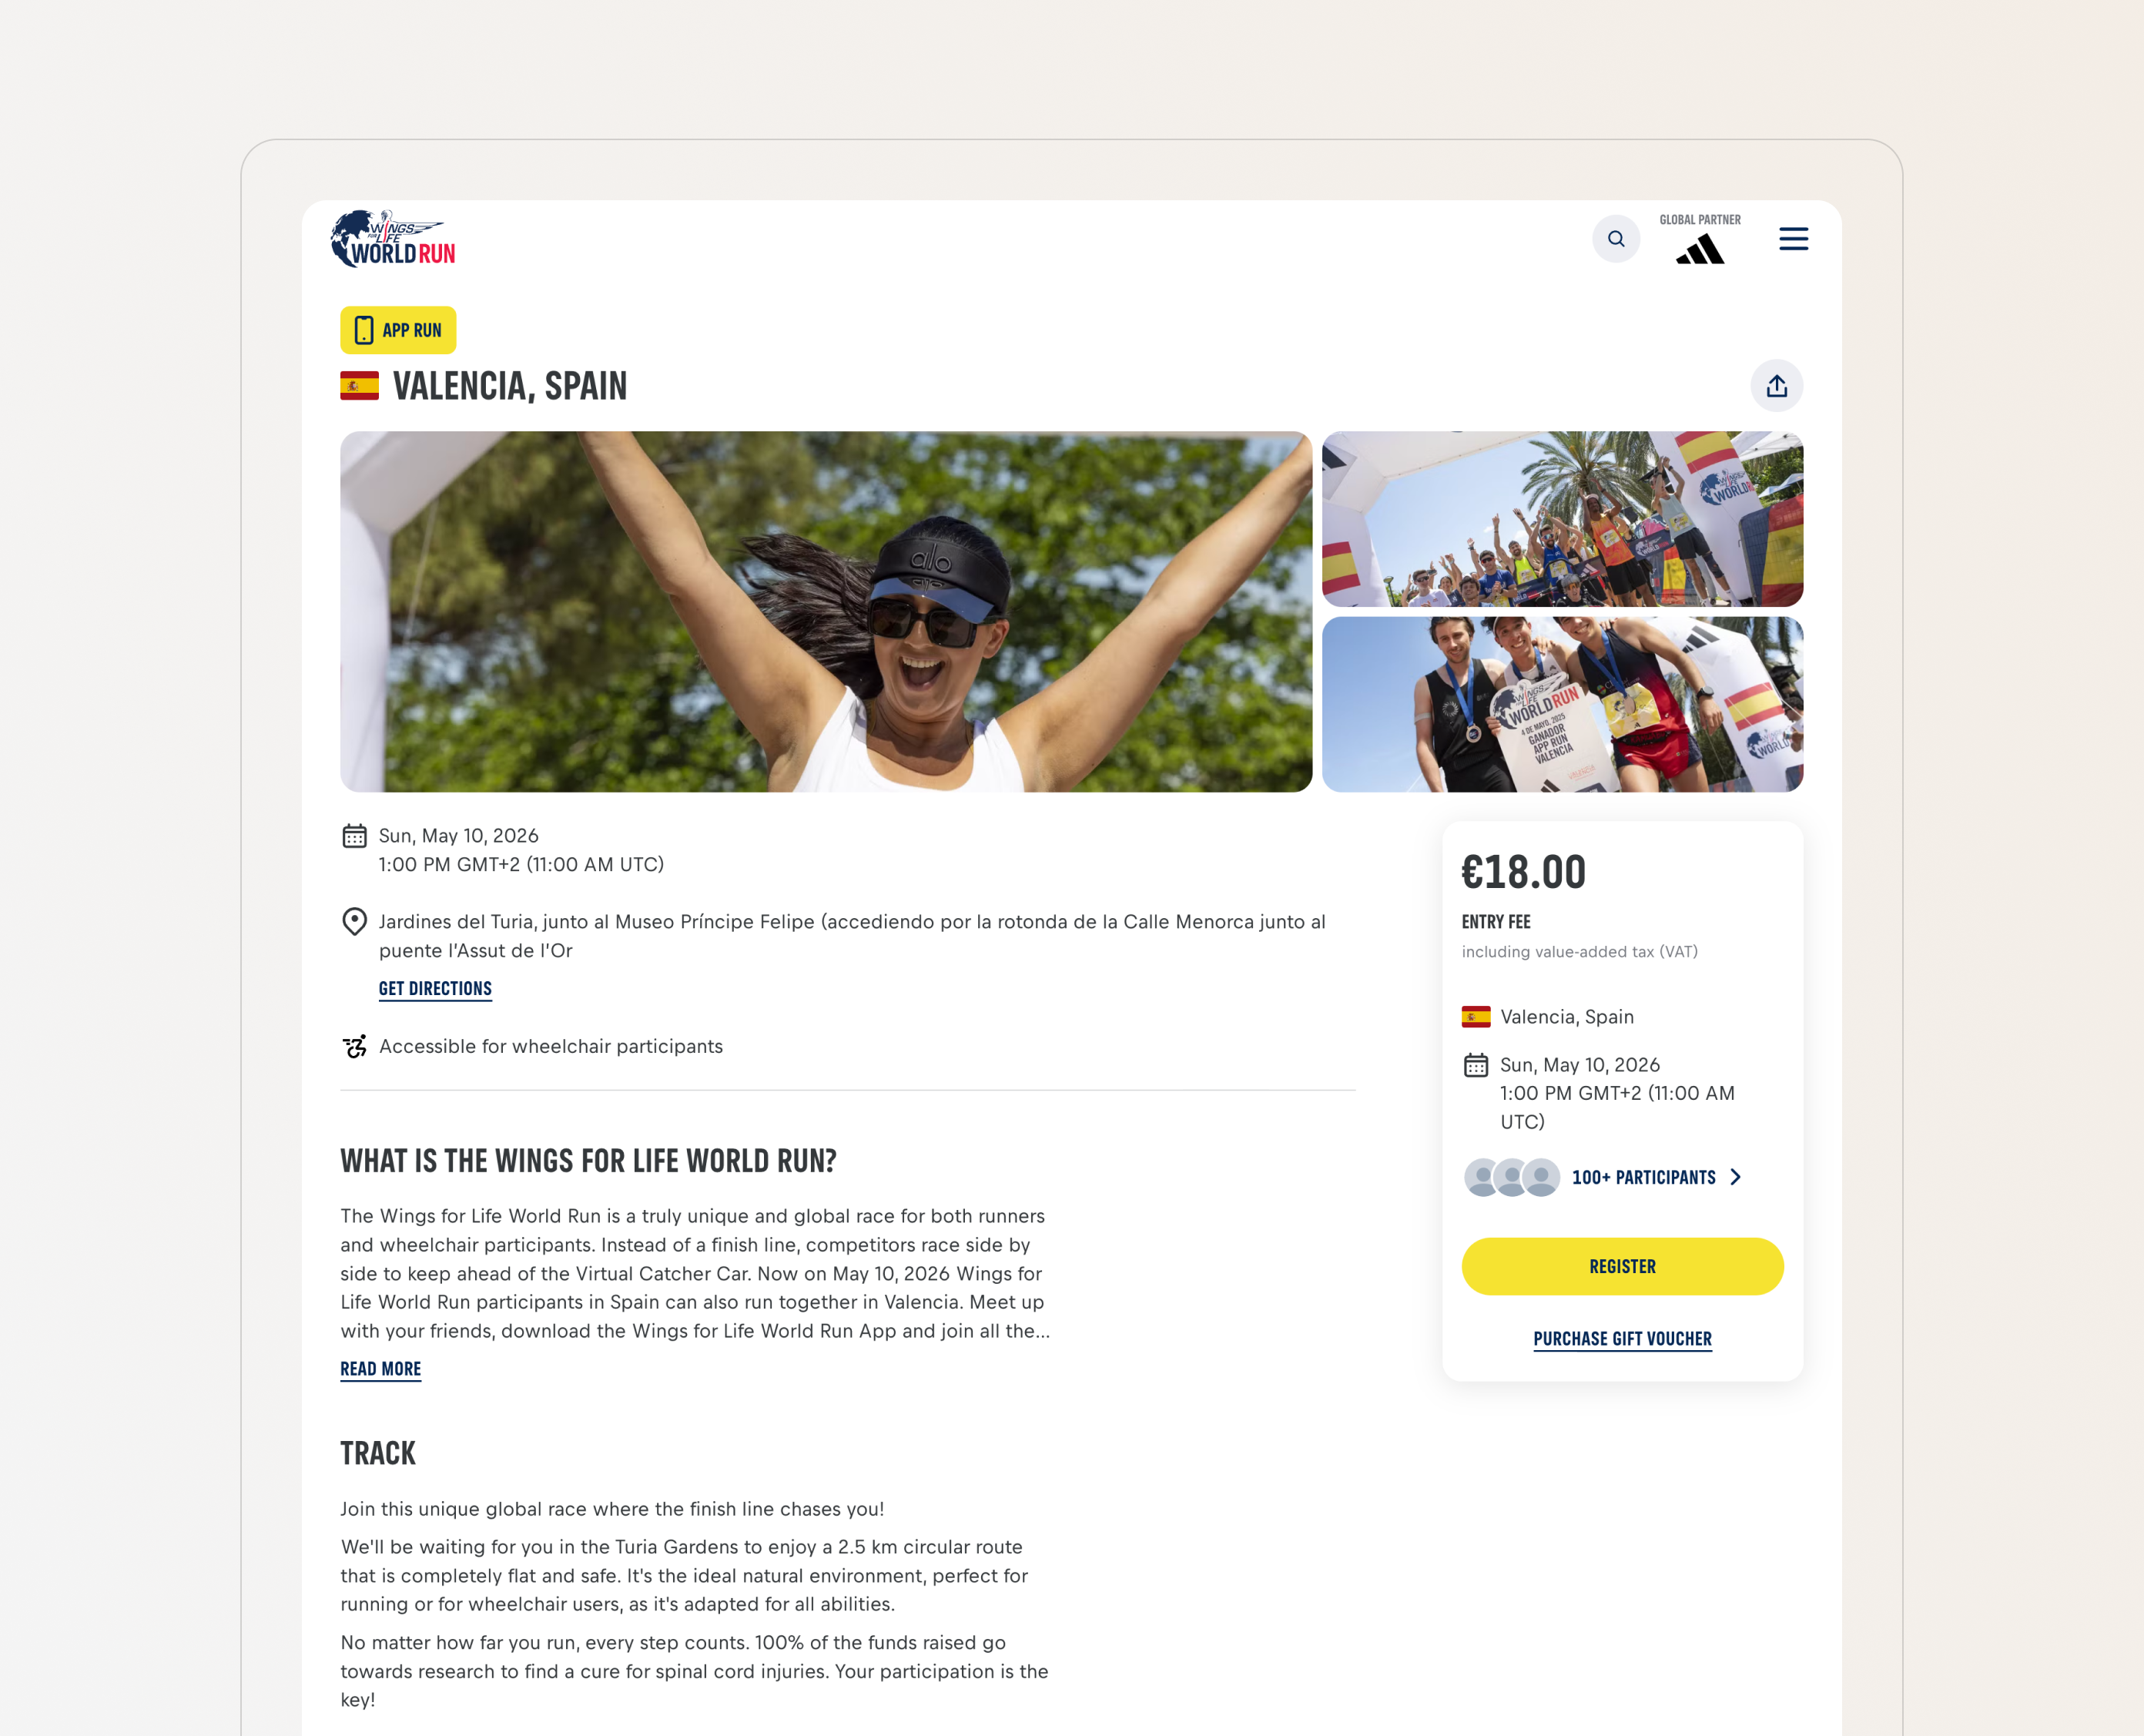
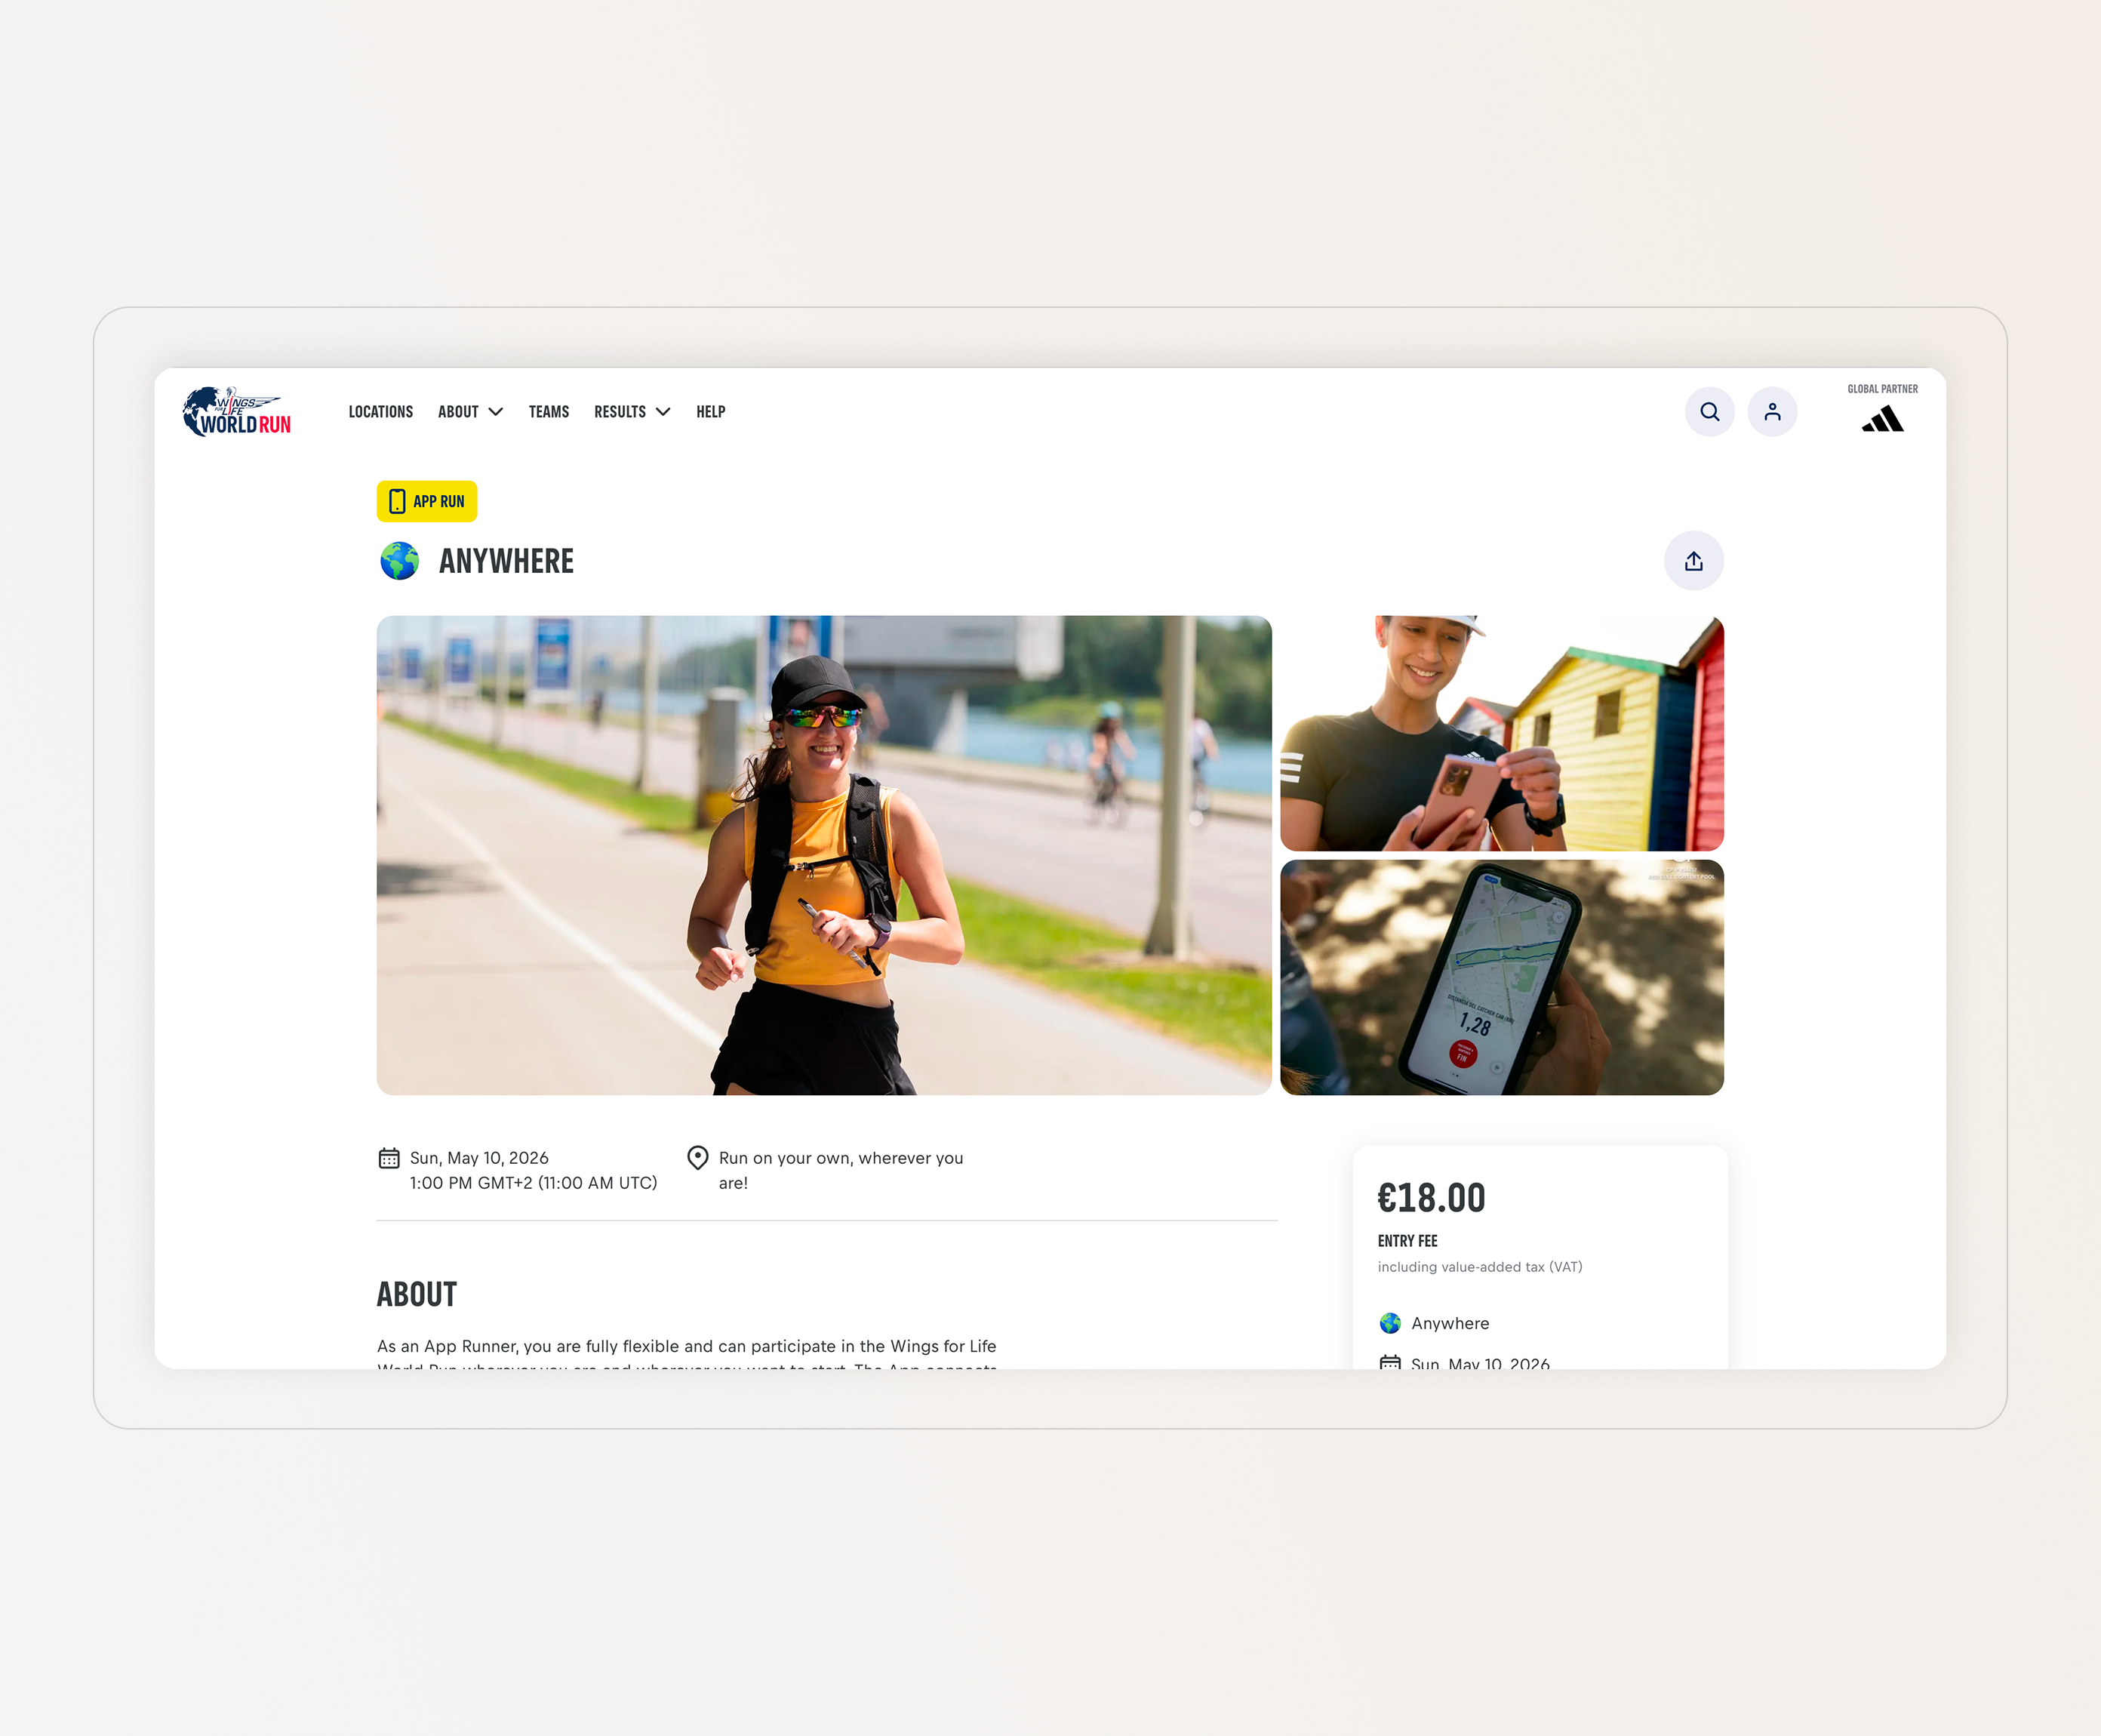
Selecting an event card opens a dedicated race page where users can explore detailed information, including the location, race rules, and participation options. From there, users can easily purchase a ticket to join the event. All proceeds from the project are directed toward research on spinal cord diseases, supporting those who are unable to run themselves.
Race calculator
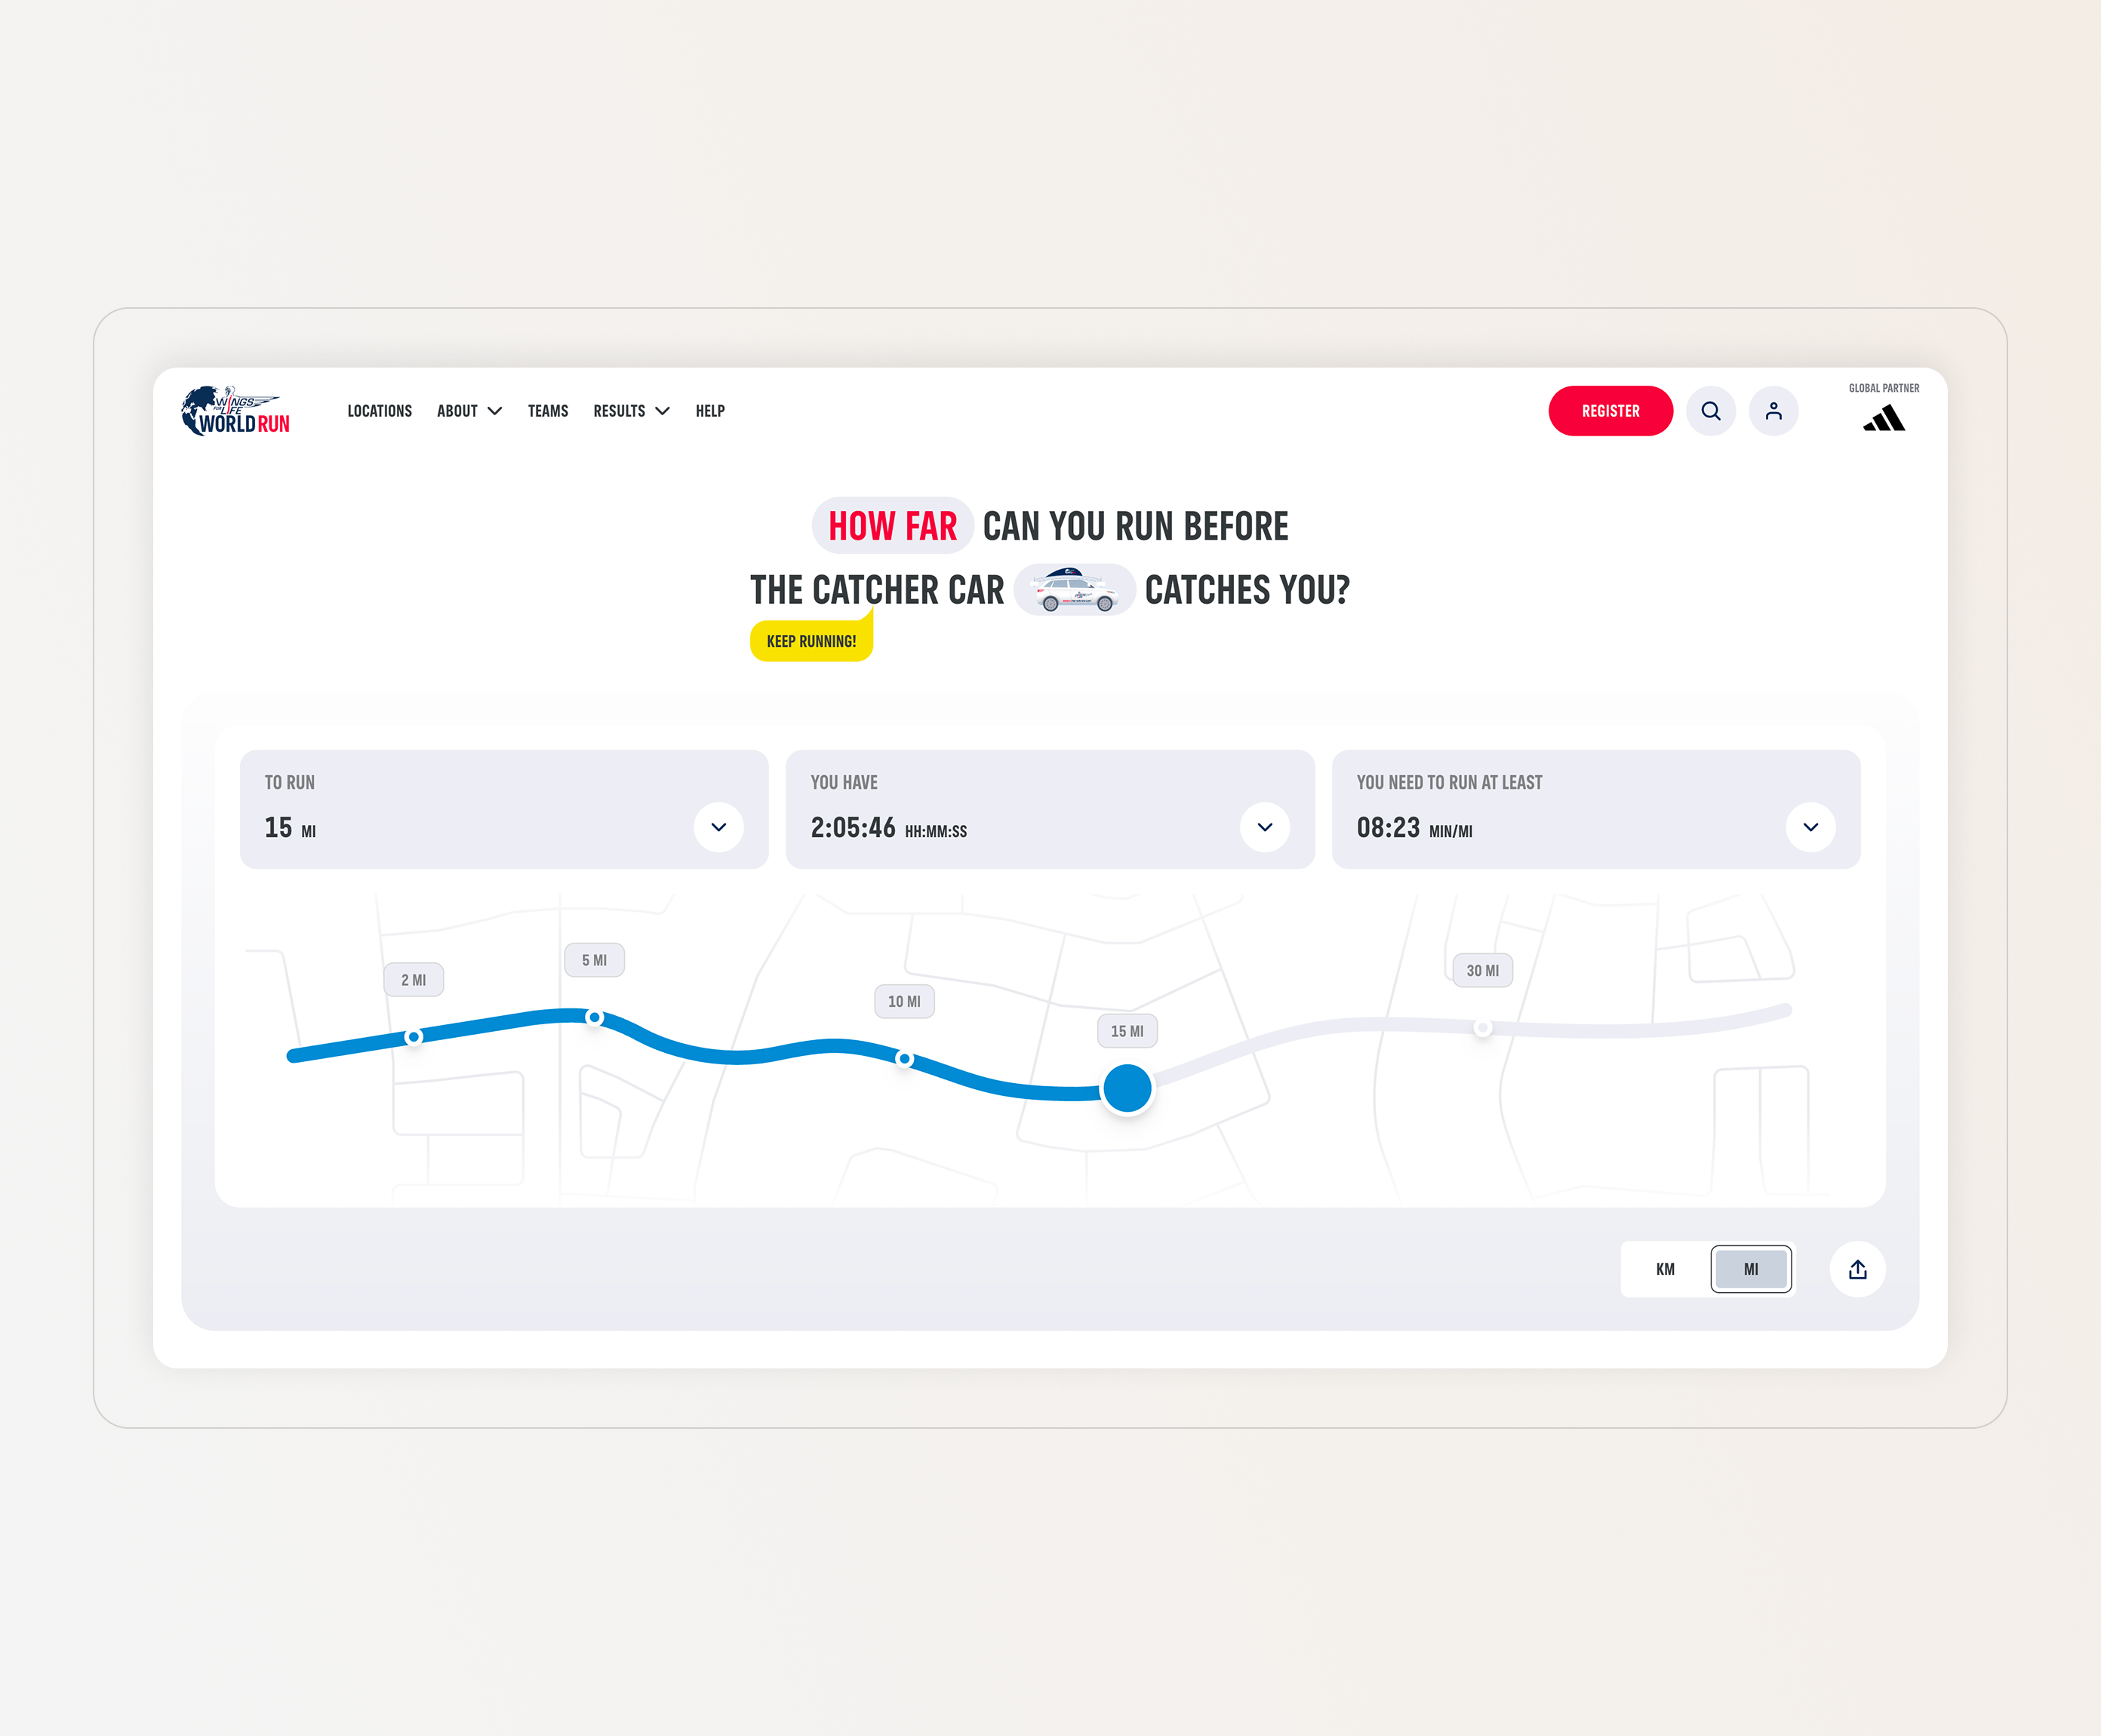
Special attention was given to the race calculator, where multiple concept variations were explored, each emphasizing different types of information. Ultimately, the chosen direction focused on microinteractions, creating a more engaging and dynamic user experience.
In this version, users can visualize the car’s journey—representing the moving finish line—and interactively understand the race mechanics.
The calculator allows participants to estimate the pace required to cover a specific distance and determine how long it will take before the car catches up to them. The core objective becomes clear: the winner is the runner who reaches the finish line before being overtaken by the car.
Result
As a result of the redesign, the platform successfully supported a series of annual races, bringing together more than 250,000 participants from over 160 countries. Over time, the initiative raised more than €60 million, all of which was fully allocated to spinal cord injury research.
On a local level, the updated design led to a 5.5% increase in mobile application engagement and boosted the site’s overall reach by 30% compared to previous performance metrics.


Wings for Life World Run
/10
live project
Client
Red Bull, Wings for Life World Run
Industry
Global charity race, Foundation
Involvement
Wire-framing, UI/UX Design, Graphic Design, Design System
task
The client required a redesign of the existing website to make it more modern, interactive, and accessible to a broad audience, including both participants and followers.
approach
My proposal was to create a dynamic path illustrating the car’s movement from point to point, serving as the central design element. This path would unify the different sections into a cohesive journey, with visual content that evolves and updates as the user scrolls.
A global run for everyone.
This race is unique. Everyone starts at the same time around the world, running together against the Catcher Car. 100% of all entry fees and donations go directly to research and help find a cure for spinal cord injury.
Design Concepts
The first step was to develop several mood boards that captured a range of styles and explored different design directions based on the selected ideas. From these, I created three distinct concepts, each reflecting a unique approach to page navigation, with varying color palettes and typography. The primary focus, however, was on the visual elements—highlighting the race participants and clearly conveying the core idea of the project.
Concept 1
Concept 2
Concept 3
Final Design, Home page
After reviewing the concepts, the client defined the main direction for the design. The final homepage was then developed using road-inspired elements and a car visualization as key components. Various micro-interactions were also introduced across scroll sections—for example, subtle image movements and hover effects on data sections, event cards, and store products. These dynamic elements made the site feel more engaging and lively, helping to capture and retain users’ attention.
Additional emphasis was placed on the application itself, ensuring that each participant can quickly join an active race or stay updated with the latest news leading up to the event.
Locations
Because the race takes place globally, with participants running simultaneously around the world, it was essential to provide a comprehensive view of all available events. To achieve this, a dedicated location page was created featuring a large interactive map alongside a structured list of races.
The race closest to the user’s location is prioritized at the top of the page. Additional search and filtering options were implemented to ensure quick and intuitive navigation.
Details page
Selecting an event card opens a dedicated race page where users can explore detailed information, including the location, race rules, and participation options. From there, users can easily purchase a ticket to join the event. All proceeds from the project are directed toward research on spinal cord diseases, supporting those who are unable to run themselves.
Race calculator
Special attention was given to the race calculator, where multiple concept variations were explored, each emphasizing different types of information. Ultimately, the chosen direction focused on microinteractions, creating a more engaging and dynamic user experience.
In this version, users can visualize the car’s journey—representing the moving finish line—and interactively understand the race mechanics.
The calculator allows participants to estimate the pace required to cover a specific distance and determine how long it will take before the car catches up to them. The core objective becomes clear: the winner is the runner who reaches the finish line before being overtaken by the car.
Result
As a result of the redesign, the platform successfully supported a series of annual races, bringing together more than 250,000 participants from over 160 countries. Over time, the initiative raised more than €60 million, all of which was fully allocated to spinal cord injury research.
On a local level, the updated design led to a 5.5% increase in mobile application engagement and boosted the site’s overall reach by 30% compared to previous performance metrics.
